Global warming(1)
1. Trends in Land Surface Air Temperature(1880〜2019)
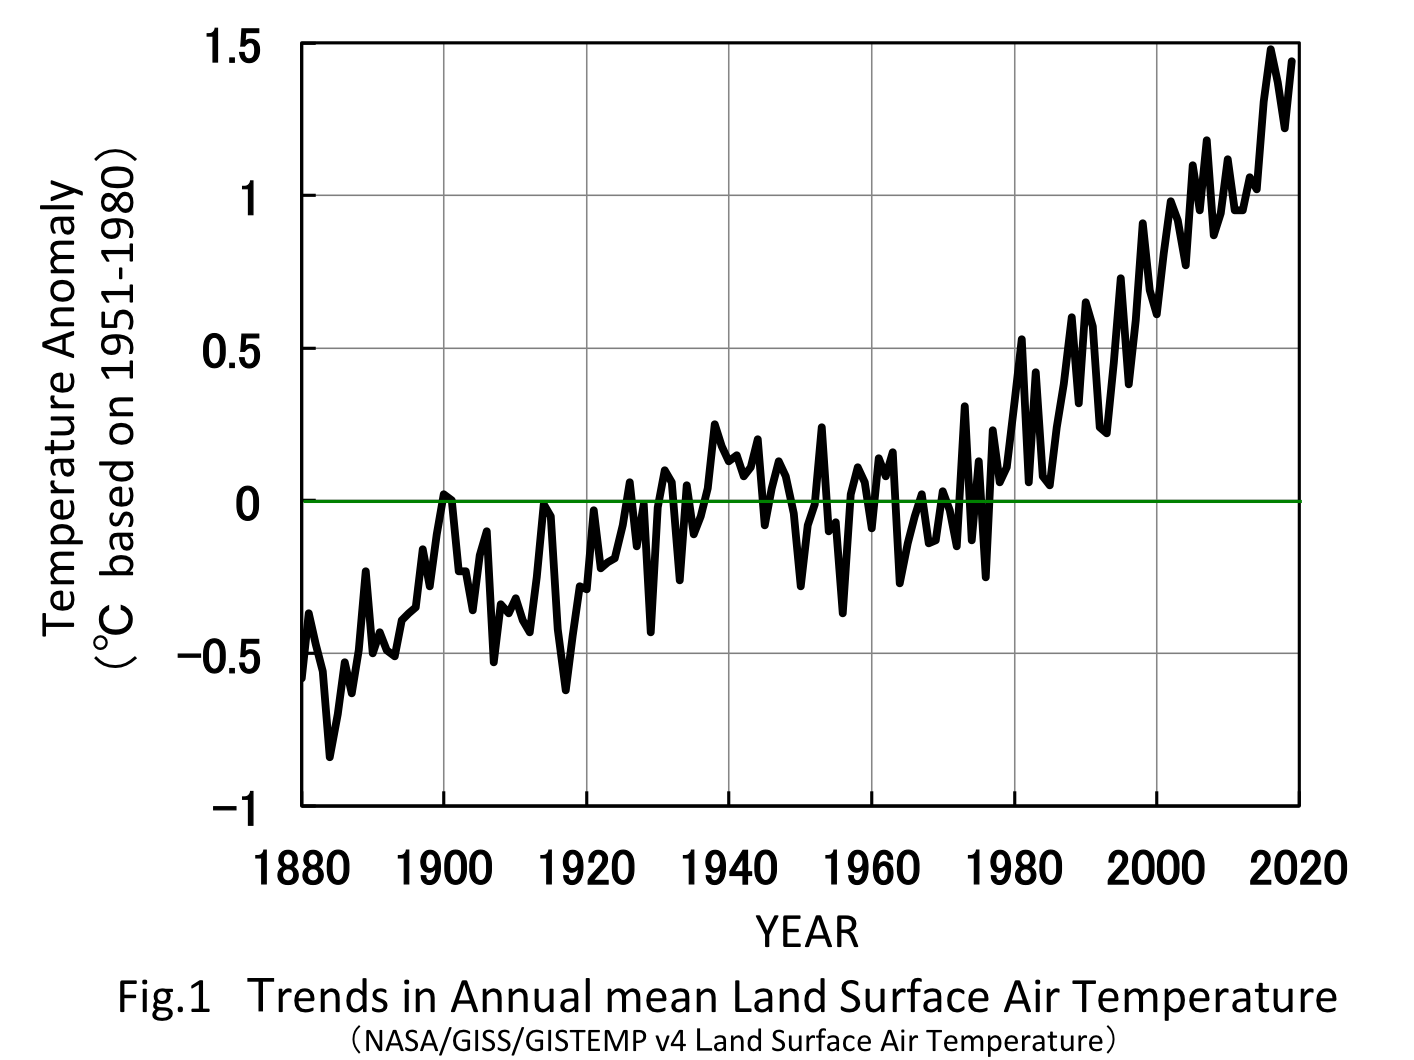
First, let's look at data on how global warming is going. Figure 1 shows the land surface air temperature trends released by the NASA Goddard Institute. The value on the vertical axis shows the fluctuation of the annual average temperature obtained from the temperature measurement results in various parts of the world based on the average temperature from 1951 to 1980.
You can see that the temperature rise has been increasing since the 1970s-1980s.
Global Warming Information from Goddard Institute2. Trends in carbon dioxide concentration in the atmosphere (1880-2019)
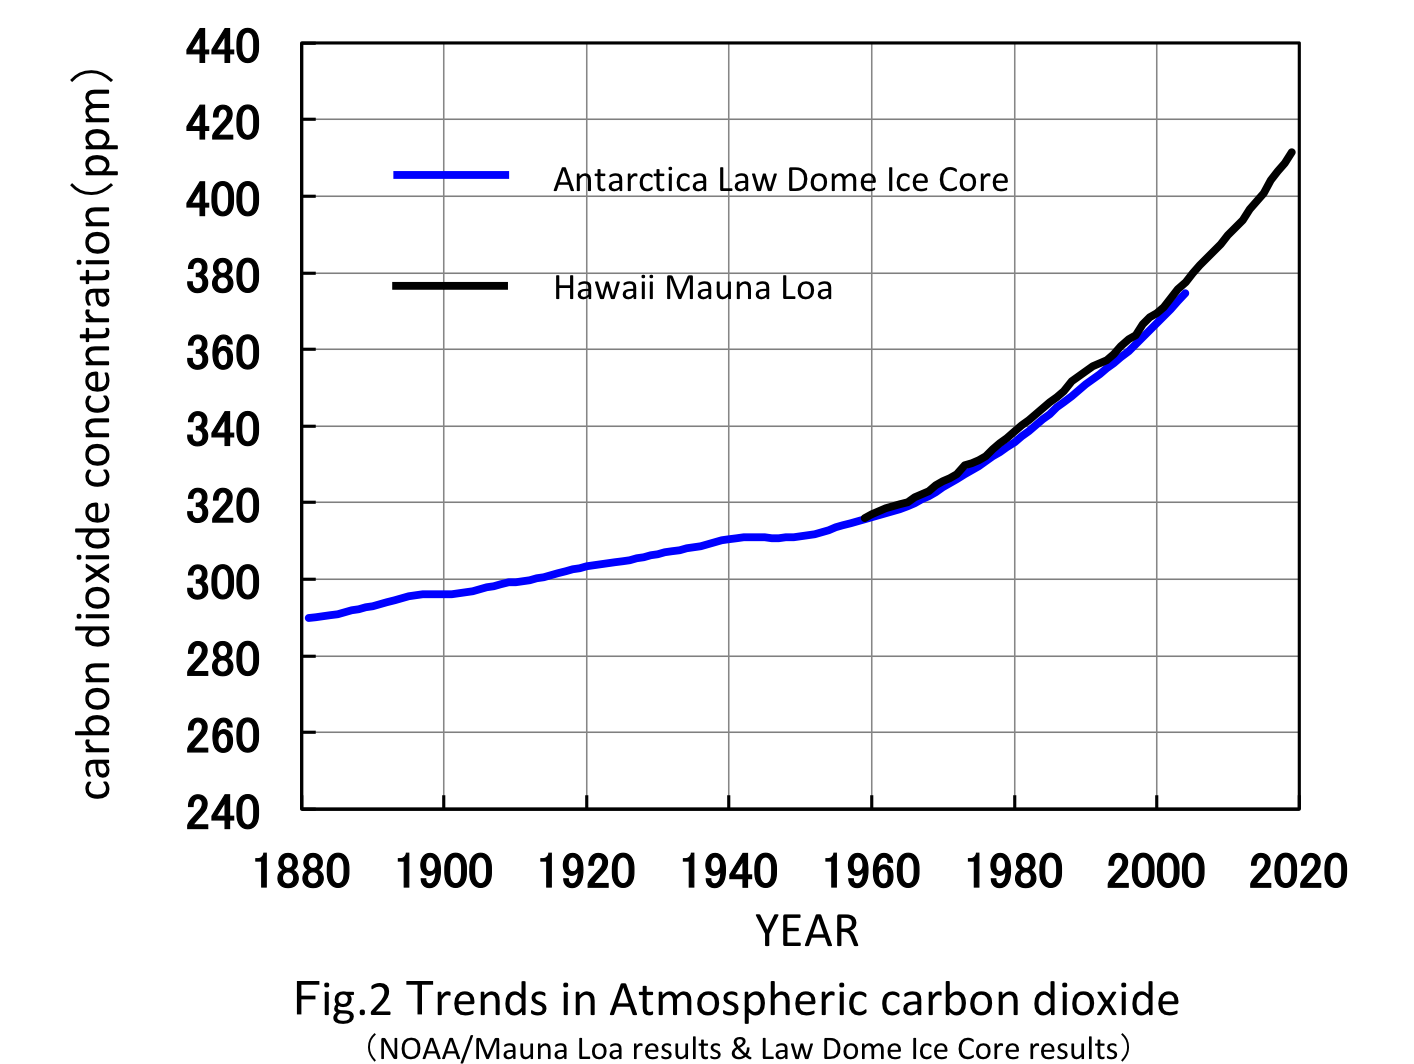
Then, what is the Trends in carbon dioxide concentration in the atmosphere during that time? Figure 2 shows the analysis of ice core in Antarctica and changes in atmospheric carbon dioxide concentration observed at Mauna Loa, Hawaii. It is very similar to the changes in Figure 1.
3. Trends in fossil fuel consumption (1880-2019)
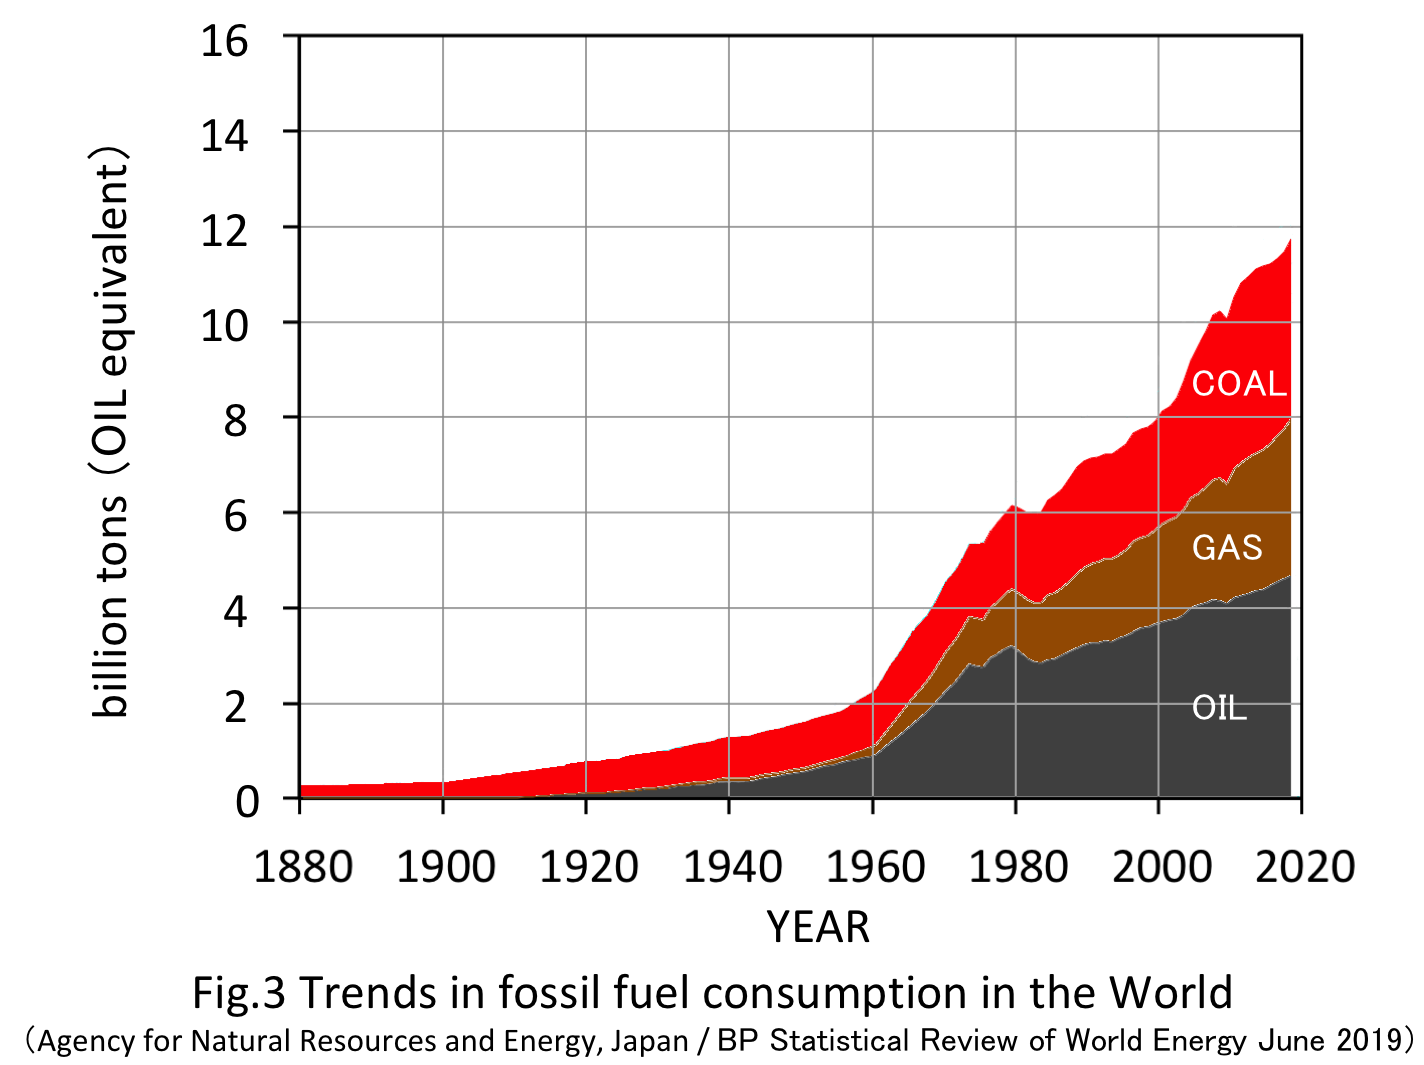
It is the use of fossil fuels (coal, oil, natural gas) that increases the atmospheric carbon dioxide. Figure 3 shows the trends in fossil fuel consumption since 1880. The increase since the 1960s is large.
By arranging Figure 1, Figure 2, and Figure 3, it can be seen that the acceleration of global warming, the increase in the atmospheric carbon dioxide and the increase in the use of fossil fuels since the 1960s are linked together.
4. 2000 years of climate change engraved on Yakusugi
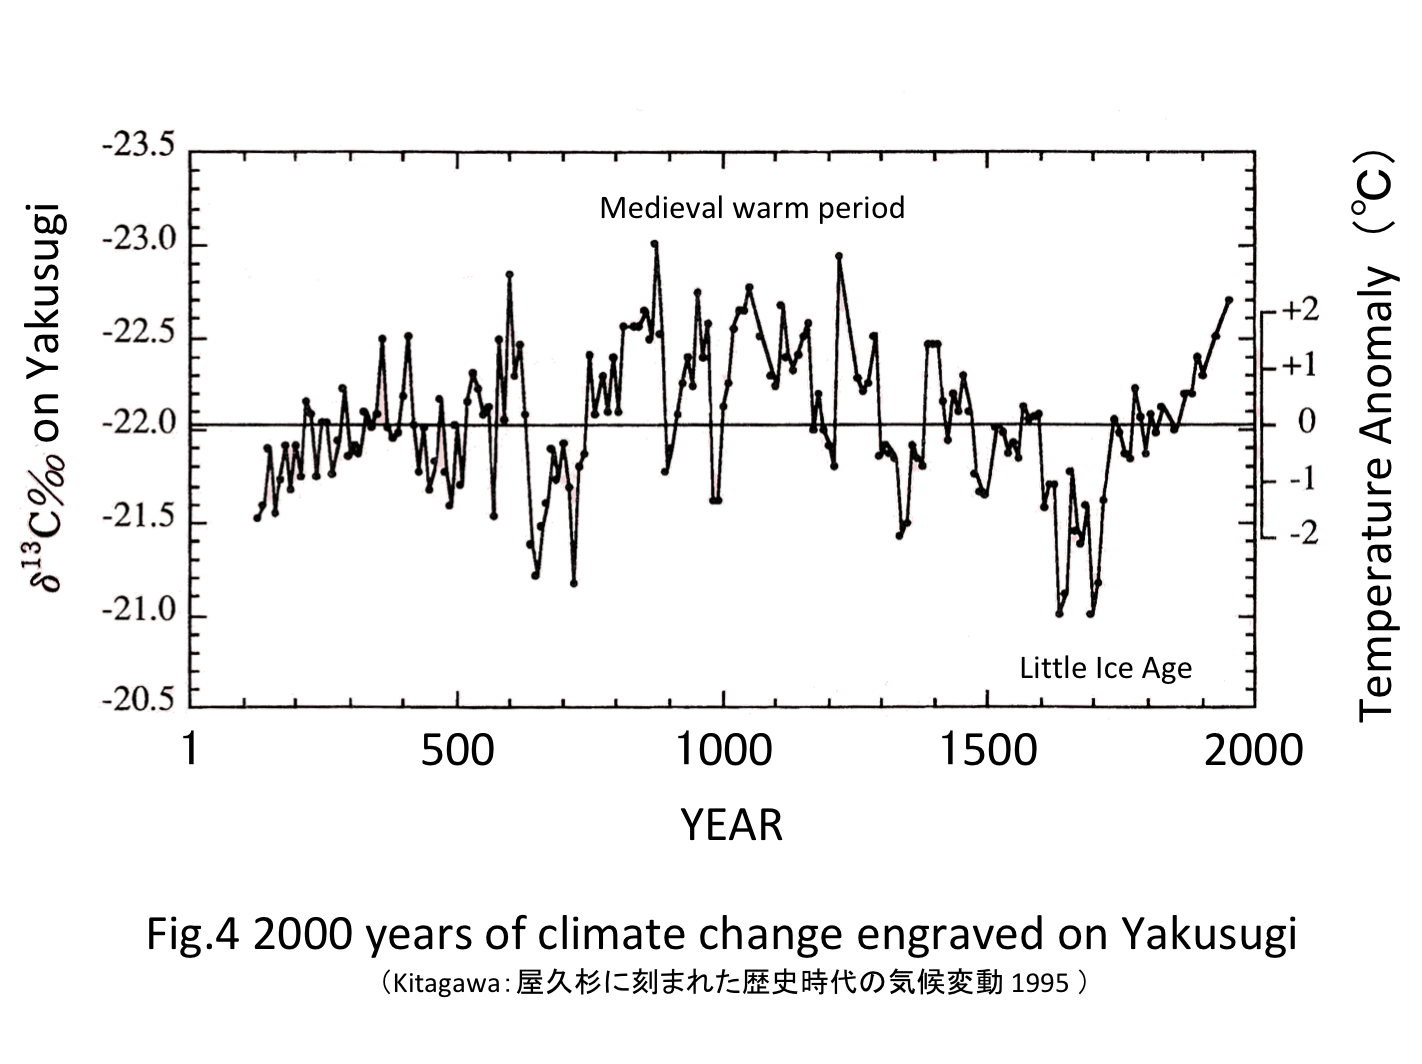
On the other hand, if you compare the climate in the past 2000 years, you can see another figure. Figure 4 shows the result of estimating the temperature change during the past 2000 years from the annual ring survey of Yakusugi on Yakushima. When Yakusugi performs photosynthesis, it is investigated by using the phenomenon that the uptake ratio of "carbon dioxide containing mass number 12 carbons" and "carbon dioxide containing mass number 13 carbons" changes with temperature.
As a result of this survey, there was a warm period (medieval warm period) around 1000 AD. That was warm as present. and there was a cold period (little ice age) around 1600 to 1800. You can see it is recovering to now through 200 years.
References5. Trends in carbon dioxide concentration in the Antarctic ice for 2000 years
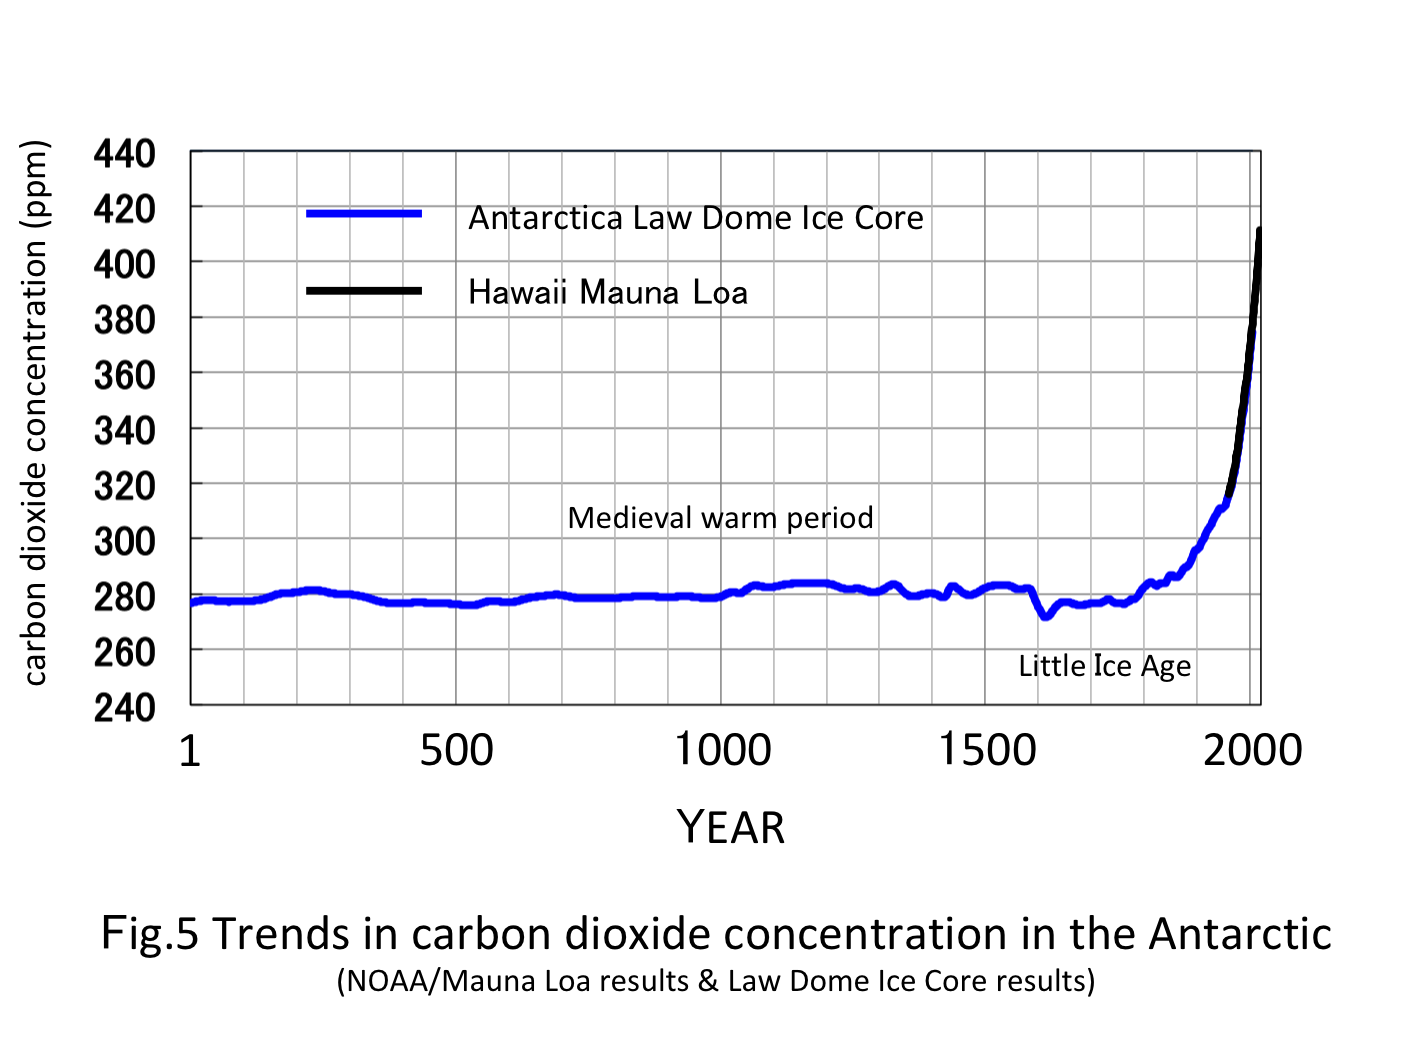
Then, what was the atmospheric carbon dioxide during that time? You can find out by analyzing ice core in Antarctica. The carbon dioxide concentration around 1000 AD when it was warm and around 1600 to 1800 when it was cold are almost the same, and it can be seen that warming and cooling occur due to other natural factors.
6. Two factors of global warming

From the Figures 1 through Figure 5, it is considered that global warming includes human activity factors shown in A of the table and natural activity factors shown in B of the table. What is the ratio of the two factors?
7. Climate change engraved on Yakusugi around 1800s
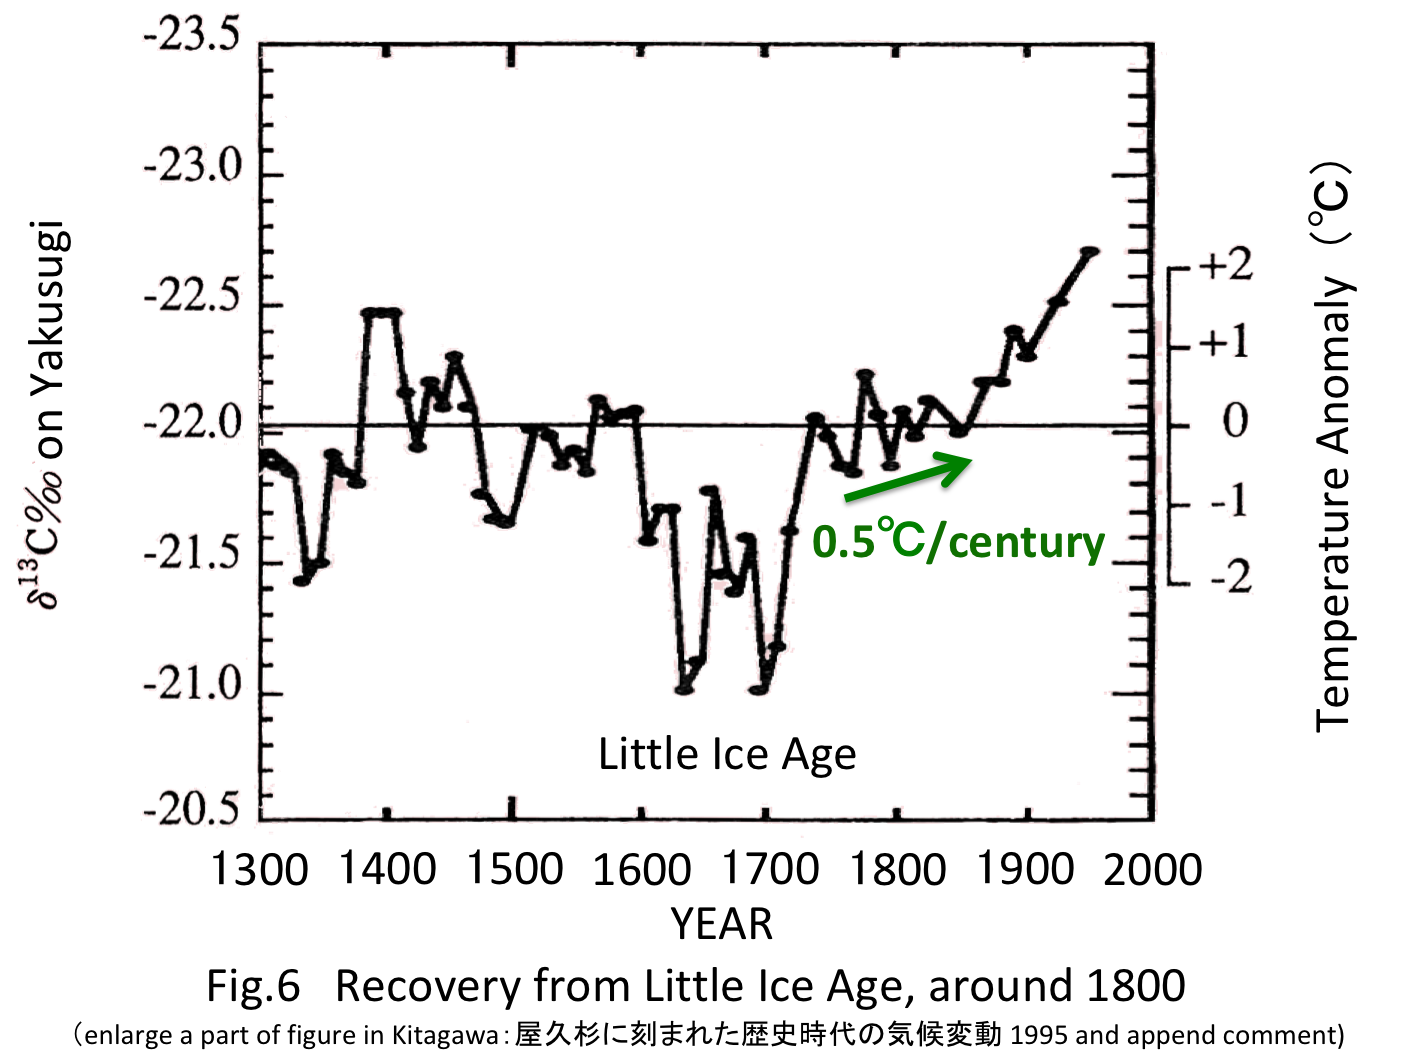
Figure 6 is an enlarged version of part of Figure 4. Looking at the recovery from the Little Ice Age. There was a tendency for the temperature to rise by +0.5°C/100 years around 1800 when the fossil fuel consumption was less than 1/100 of the present. and There is a possibility that this is continuing to the present.
8. Recovery from the Little Ice Age and warming due to human activities
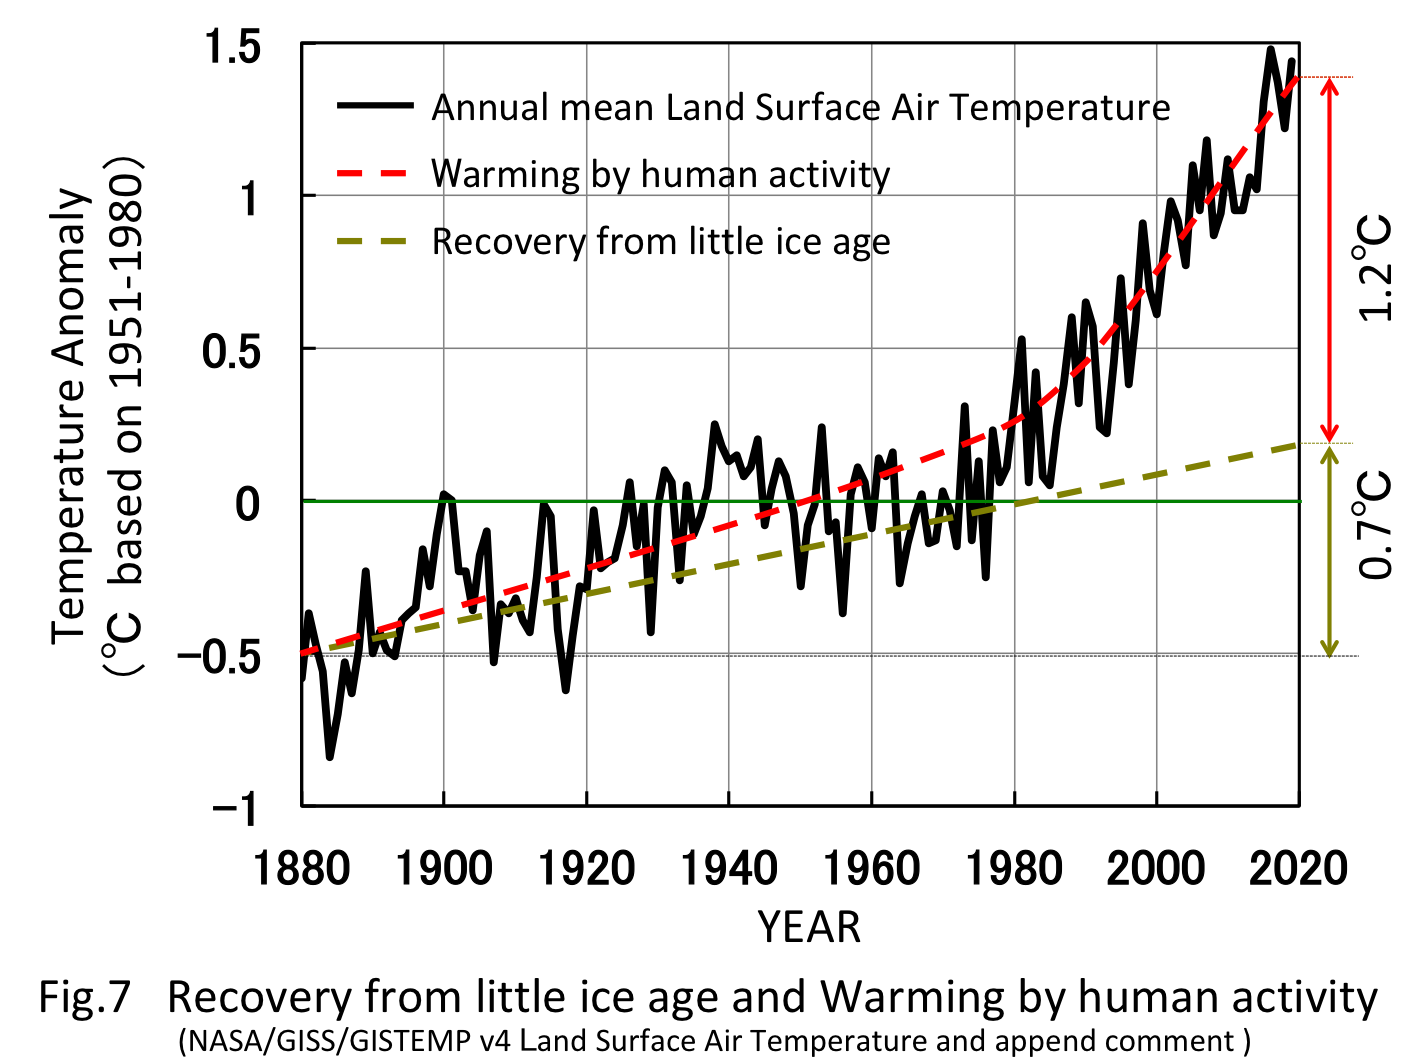
Let us roughly divide the land surface air temperature rise from 1880 to 2019 in Fig. 1 into recovery from the Little Ice Age and global warming caused by human activities (Fig. 7).
The green dotted line is the recovery from the Little Ice Age that has continued since the 1800s, and the red dotted line is the warming caused by human activity. The rough image is that the recovery from the Little Ice Age is +0.7℃, and the warming due to human activity is +1.2℃.。
On the next page, I would like to see how global warming is occurring in some places of the world.