Global warming(3)
1. Comparison of global warming and human activities
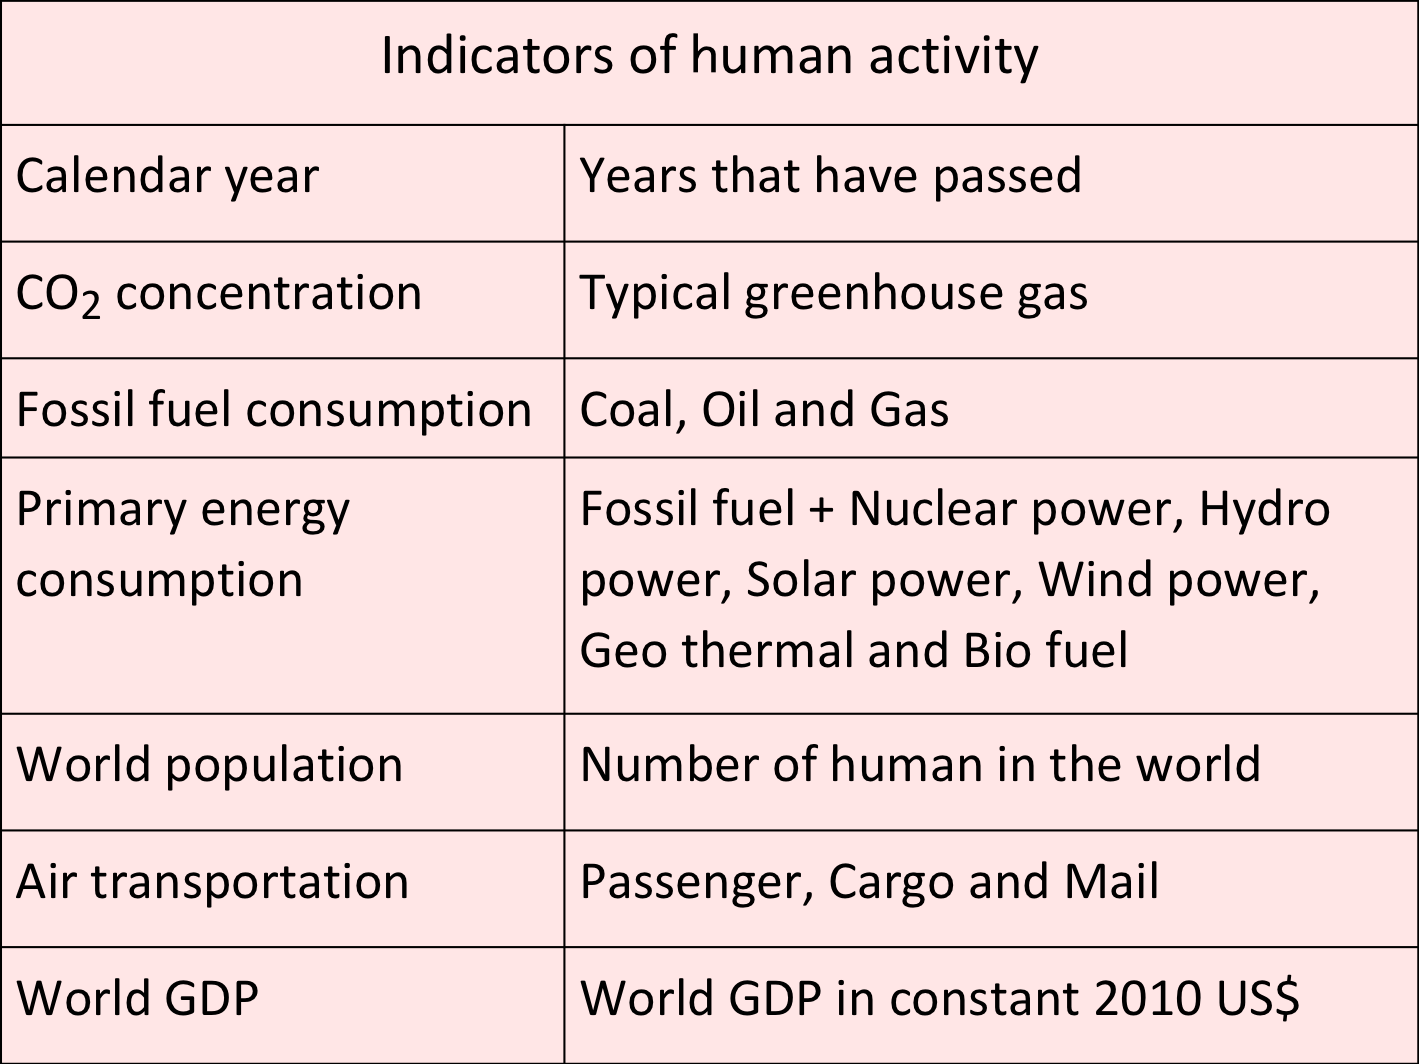
According to the fifth report of ipcc, the impact of human activities is more than half of the global warming after 1951. Let's see the correlation between the global warming and human activities. The correlation is confirmed by plotting the deviation of the temperature between them on the y-axis and the indicator of human activity that seems to be related, on the x-axis.The magnitude of the correlation is confirmed by the magnitude of the coefficient of determination of the first-order approximation line of the graph.
the first-order approximation line and the coefficient of determination2. Correlation between global warming and calendar year
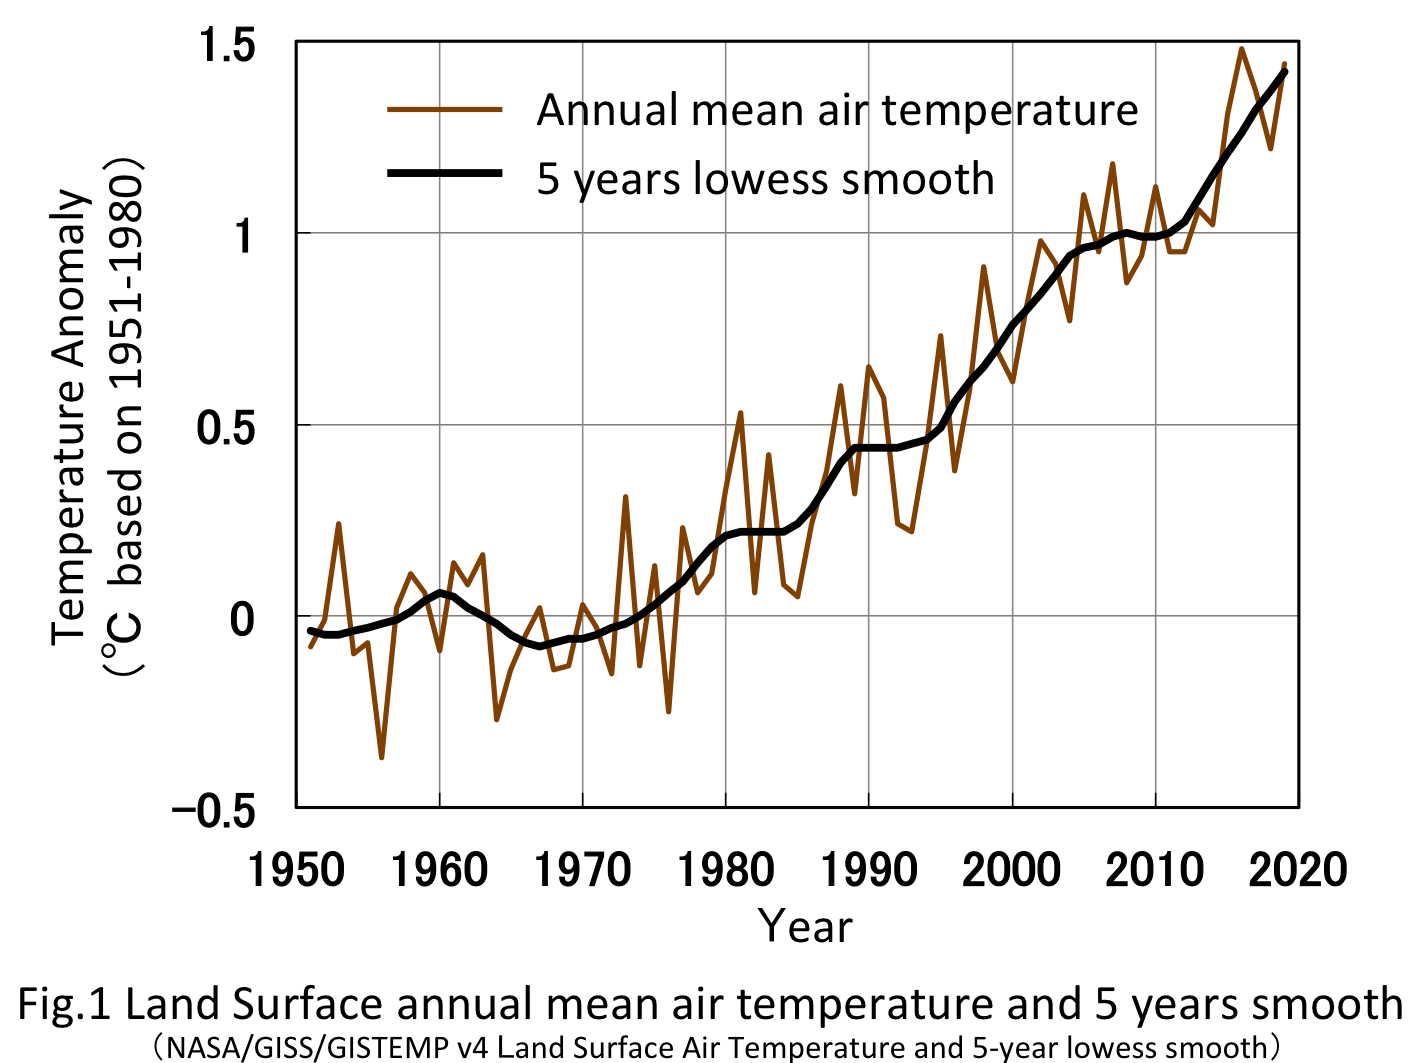
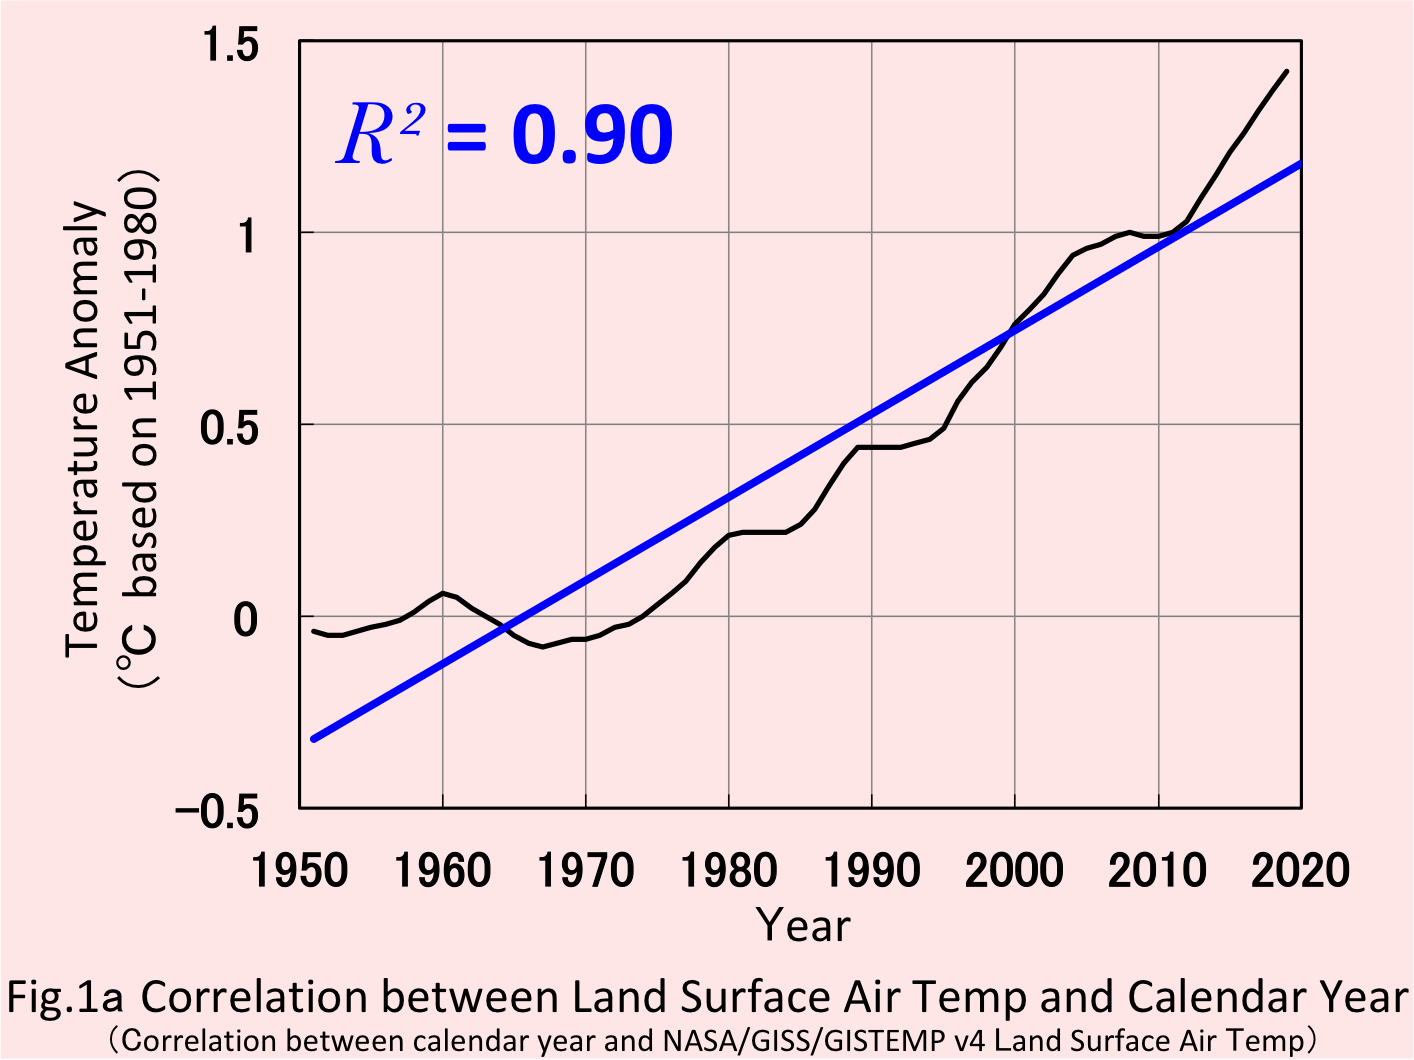
To see the correlation, the average temperature of each year varies widely, so I use the 5 year lowess smooth line of Goddard Institute. Tap the graph to display the linear approximation line between the calendar year and the temperature anomaly, and the coefficient of determination . For the calendar year it was = 0.90.
3. Correlation between global warming and carbon dioxide concentration
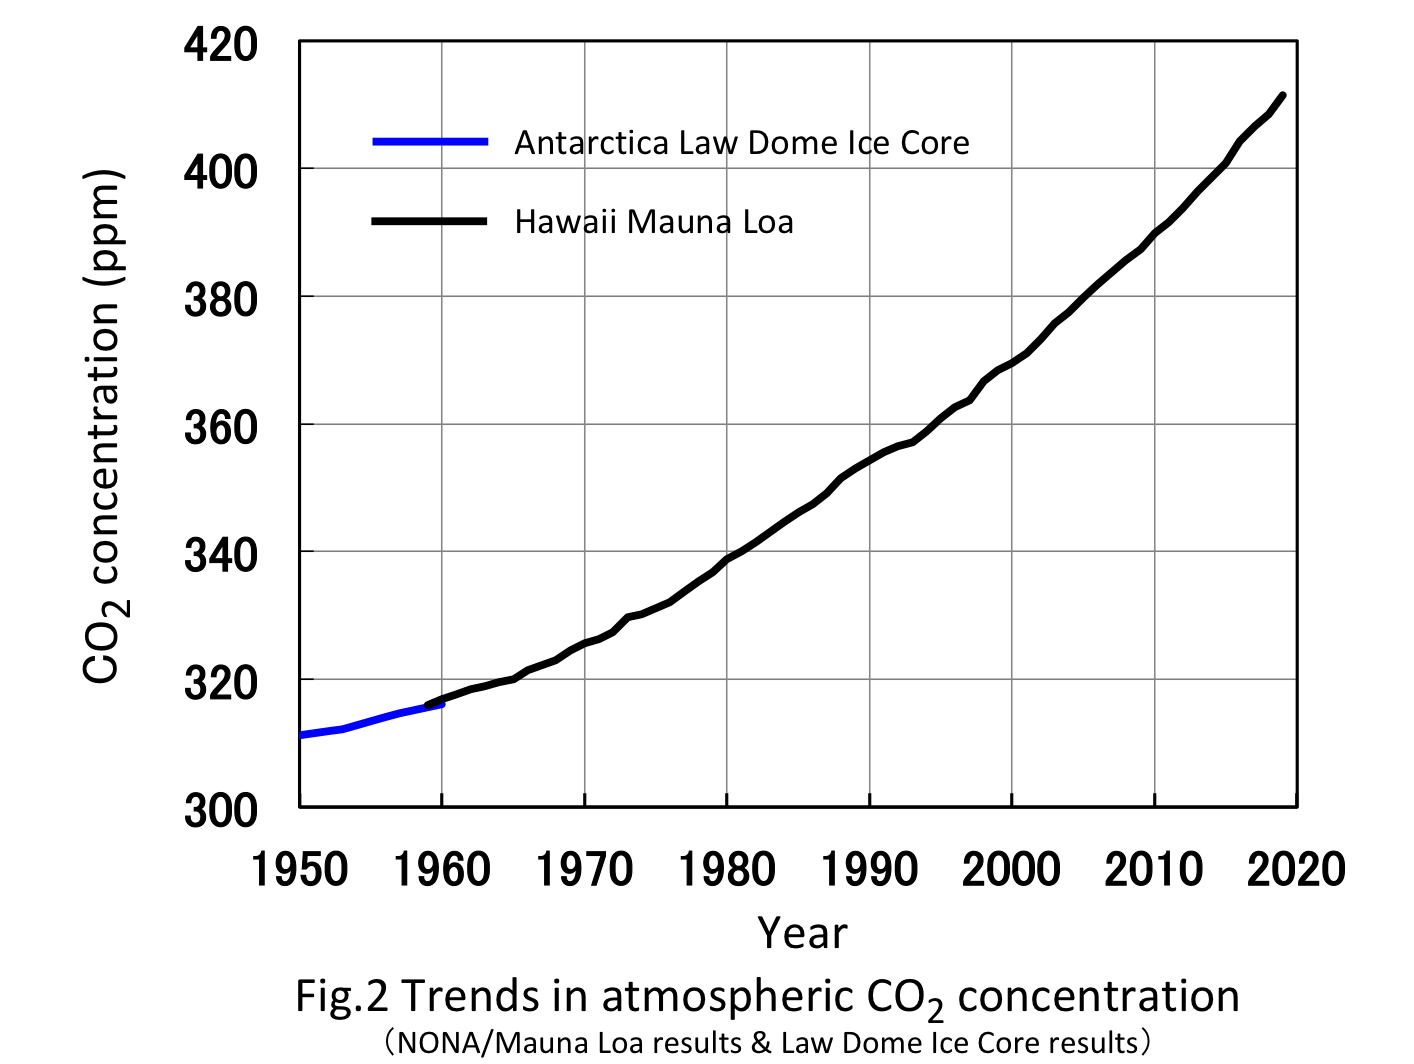
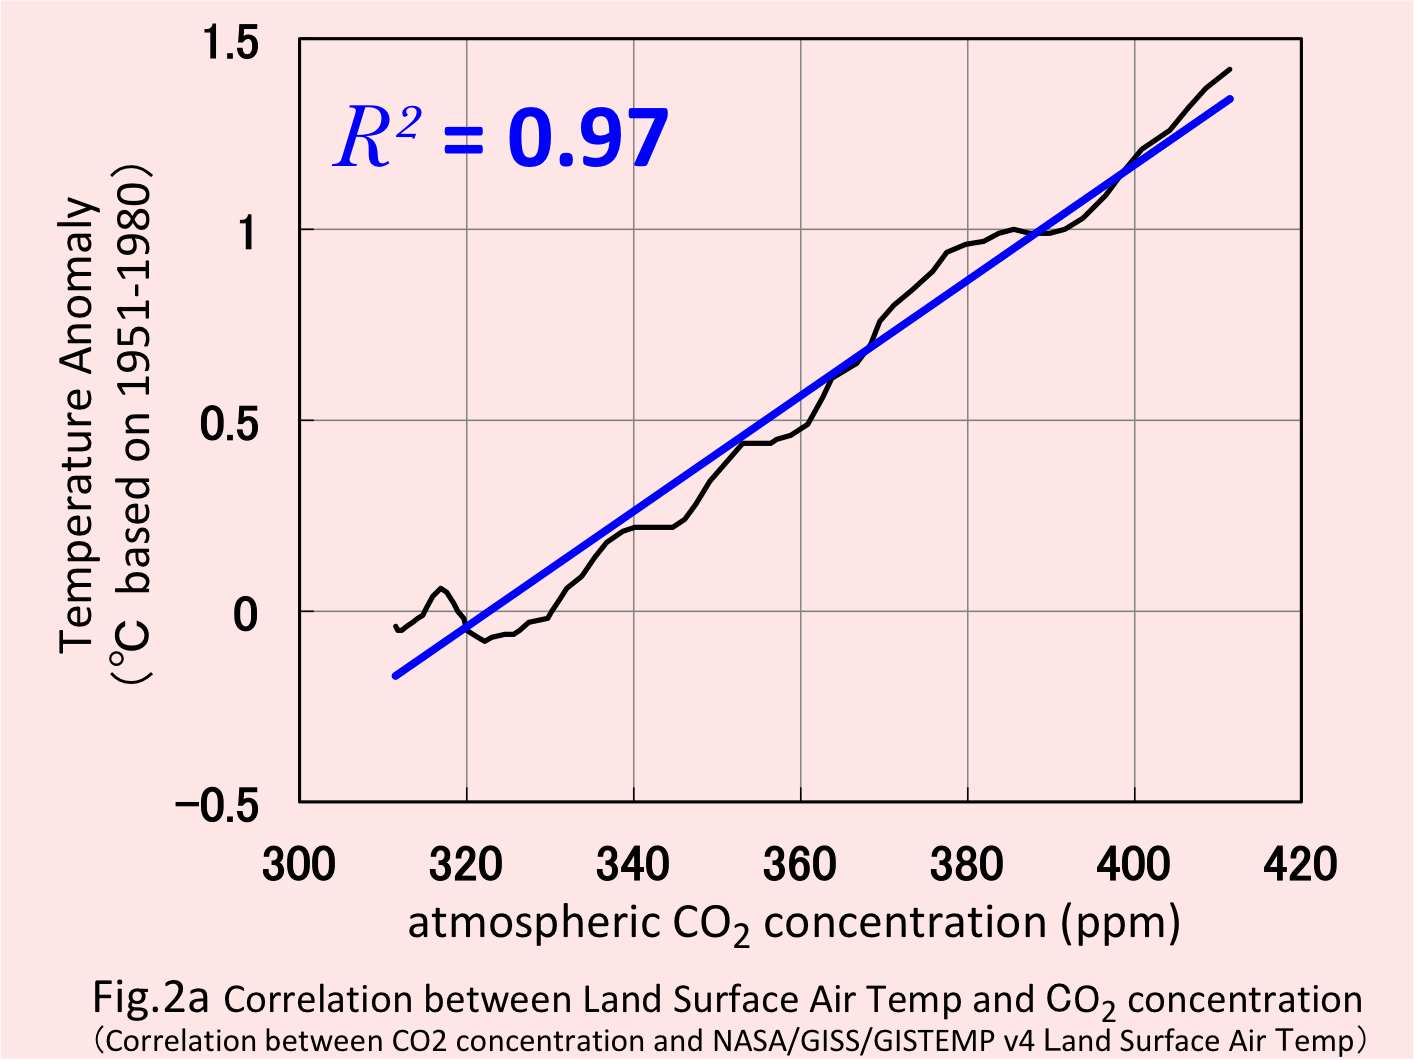
Next is the correlation between carbon dioxide as a greenhouse gas, and global warming.When you tap the graph, the horizontal axis changes to carbon dioxide concentration and the vertical axis changes to temperature anomaly, and you can see the correlation. = 0.97 shows greater correlation than calendar year.
4. Correlation between global warming and fossil fuel consumption
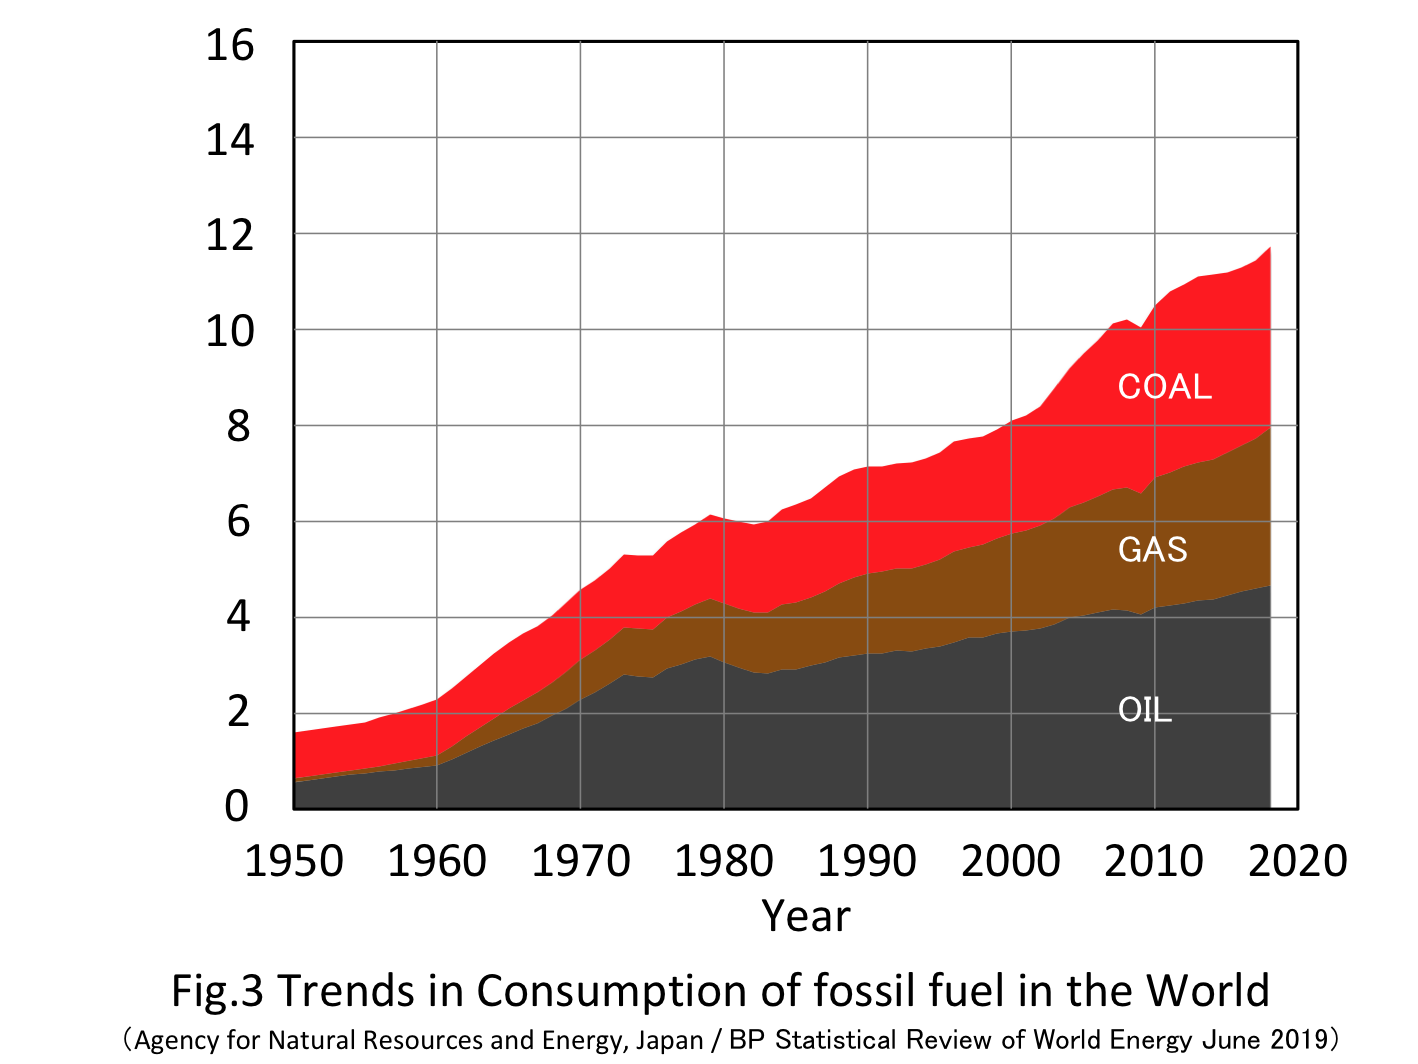
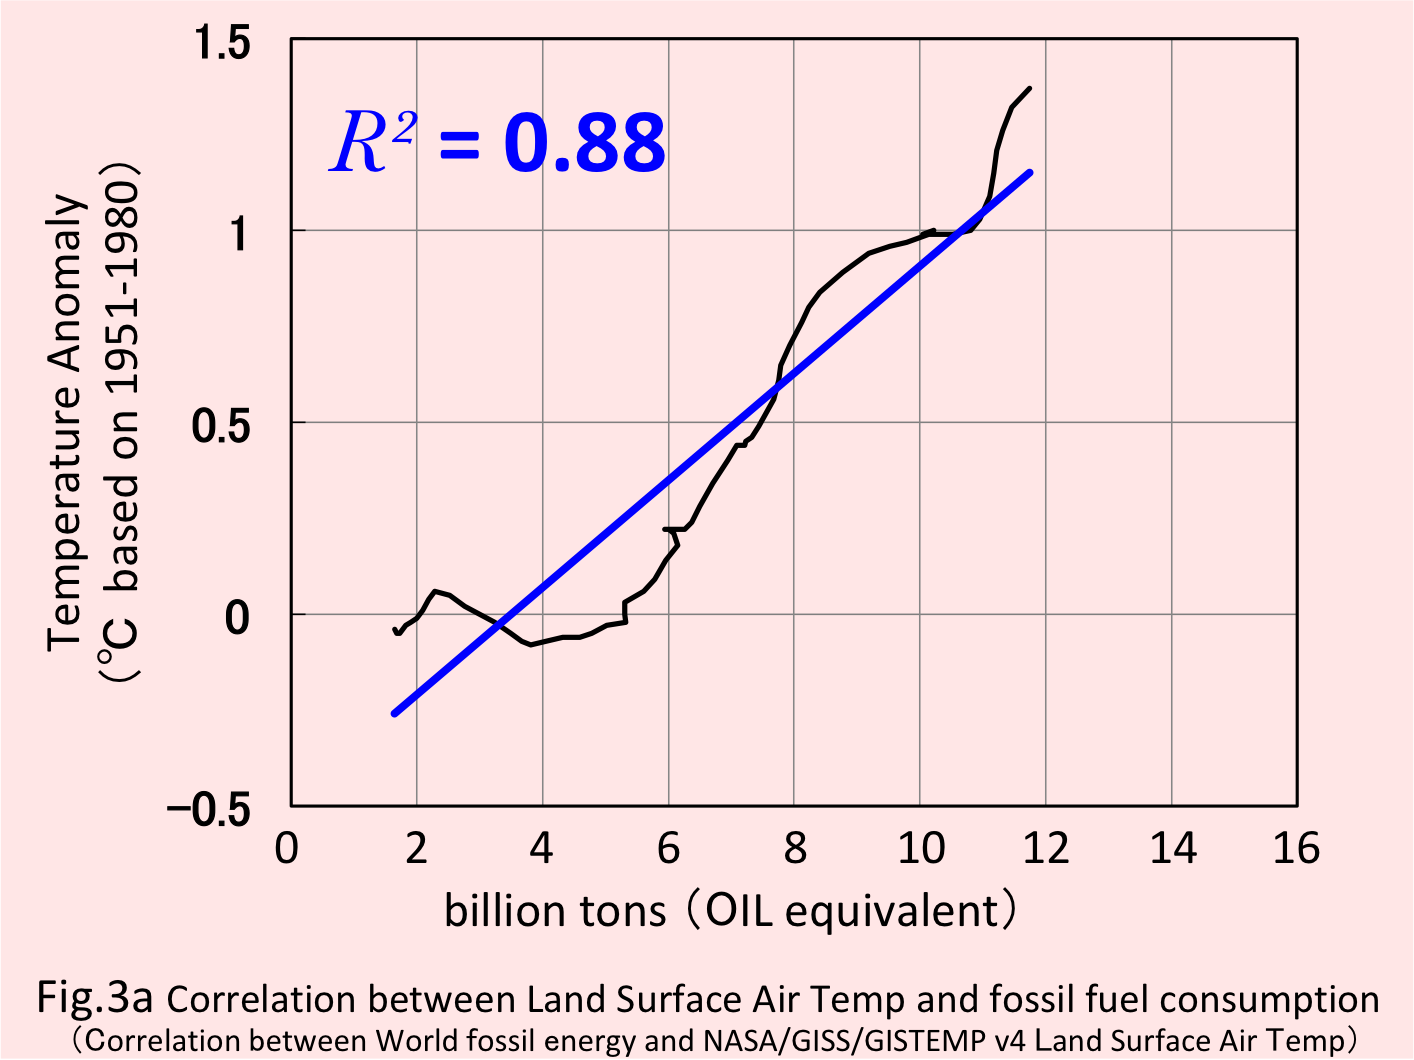
Next is the correlation between the amount of fossil fuel consumption (oil, coal, natural gas) and global warming. It was = 0.88. It shows good correlation but it is less than 0.90 of a calendar year. It seems that the temperature drop in the 1970s (about 4 to 5 billion tons of fossil fuel consumption) has caused wide variations.
5. Correlation between global warming and total primary energy consumption
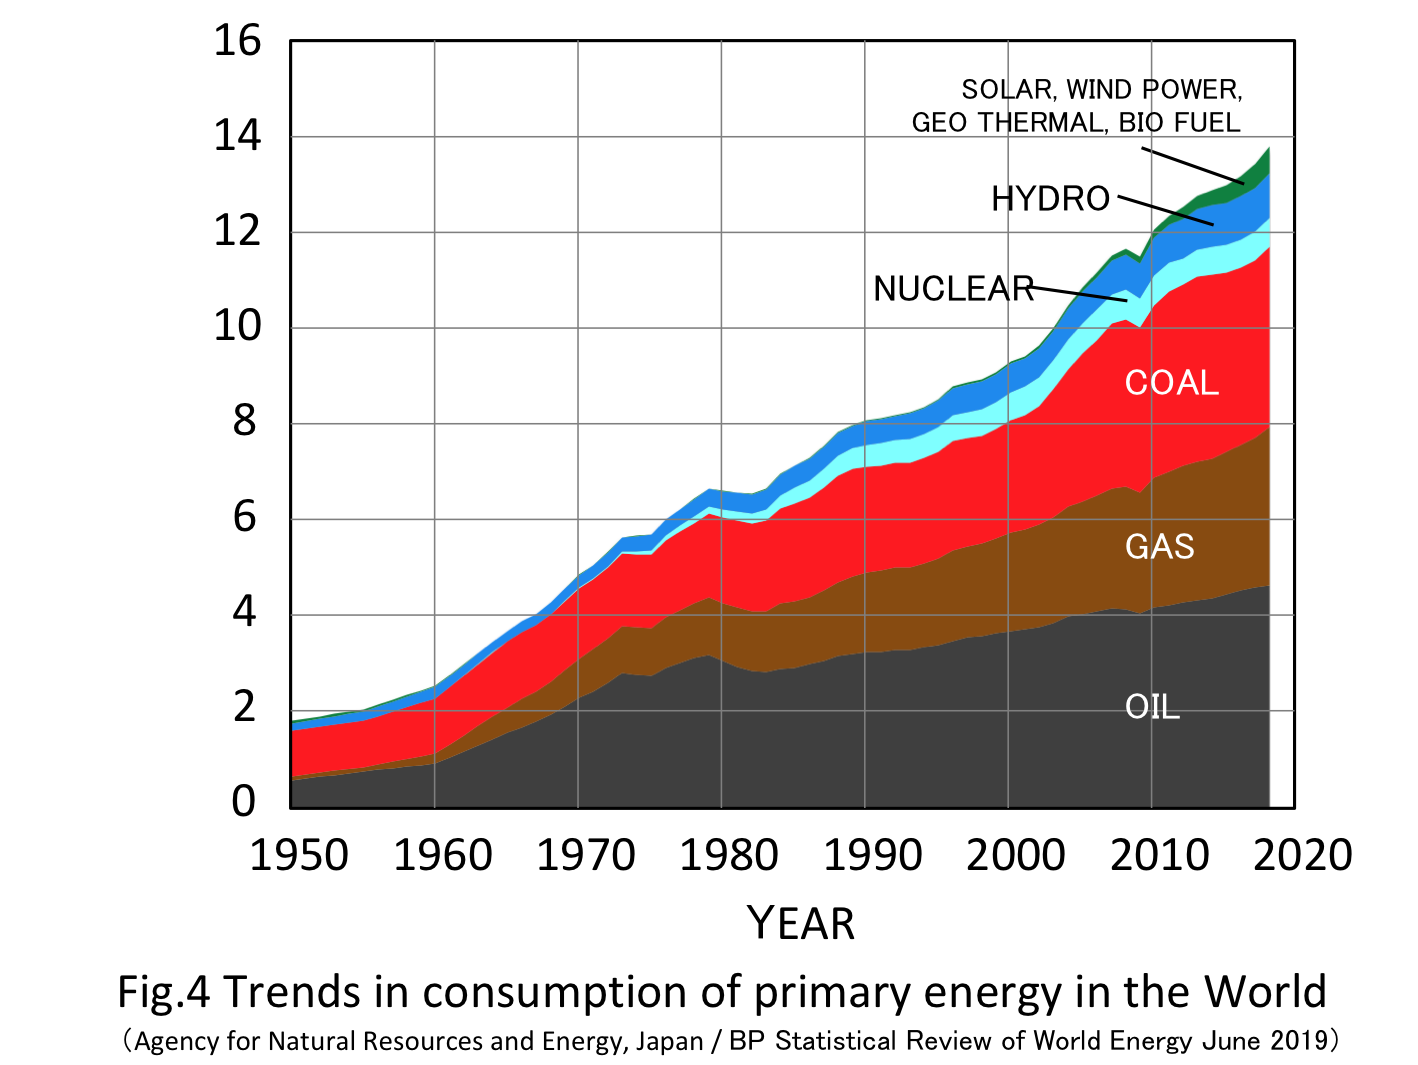
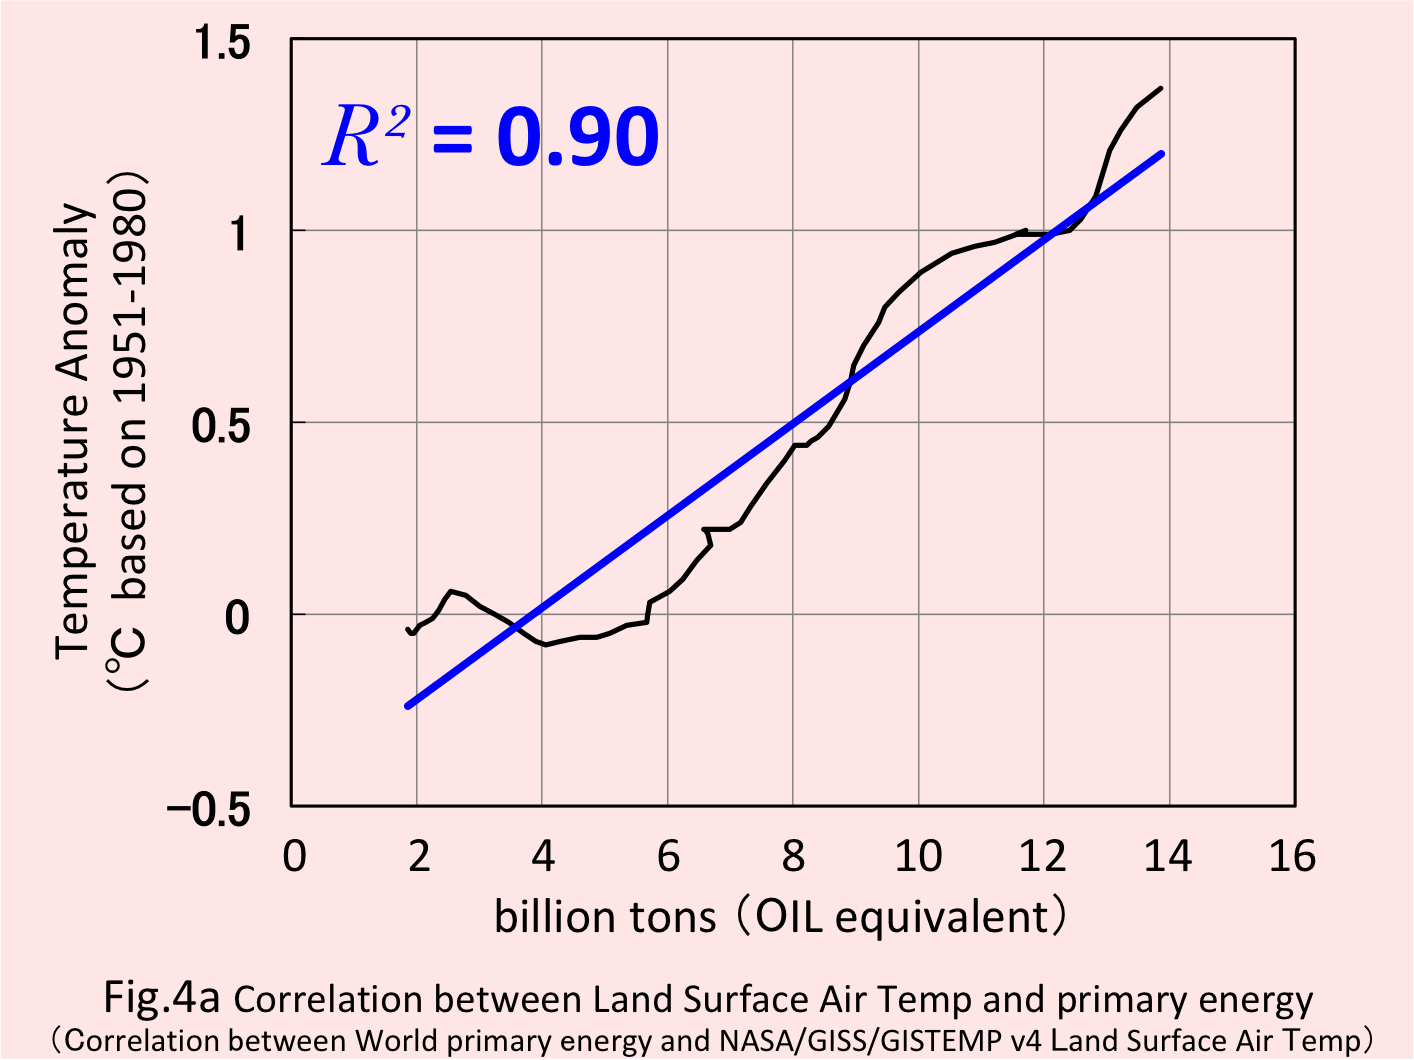
Next is the correlation between total primary energy consumption (oil, coal, natural gas, nuclear power, hydropower, solar power, wind power, geothermal energy, biofuels) and global warming. It was =0.90. It is larger than 0.88 of fossil fuel. In 2018, 15% of human activities are supported by non-fossil energy, and I think it will contribute to global warming.
6. Correlation between global warming and world population
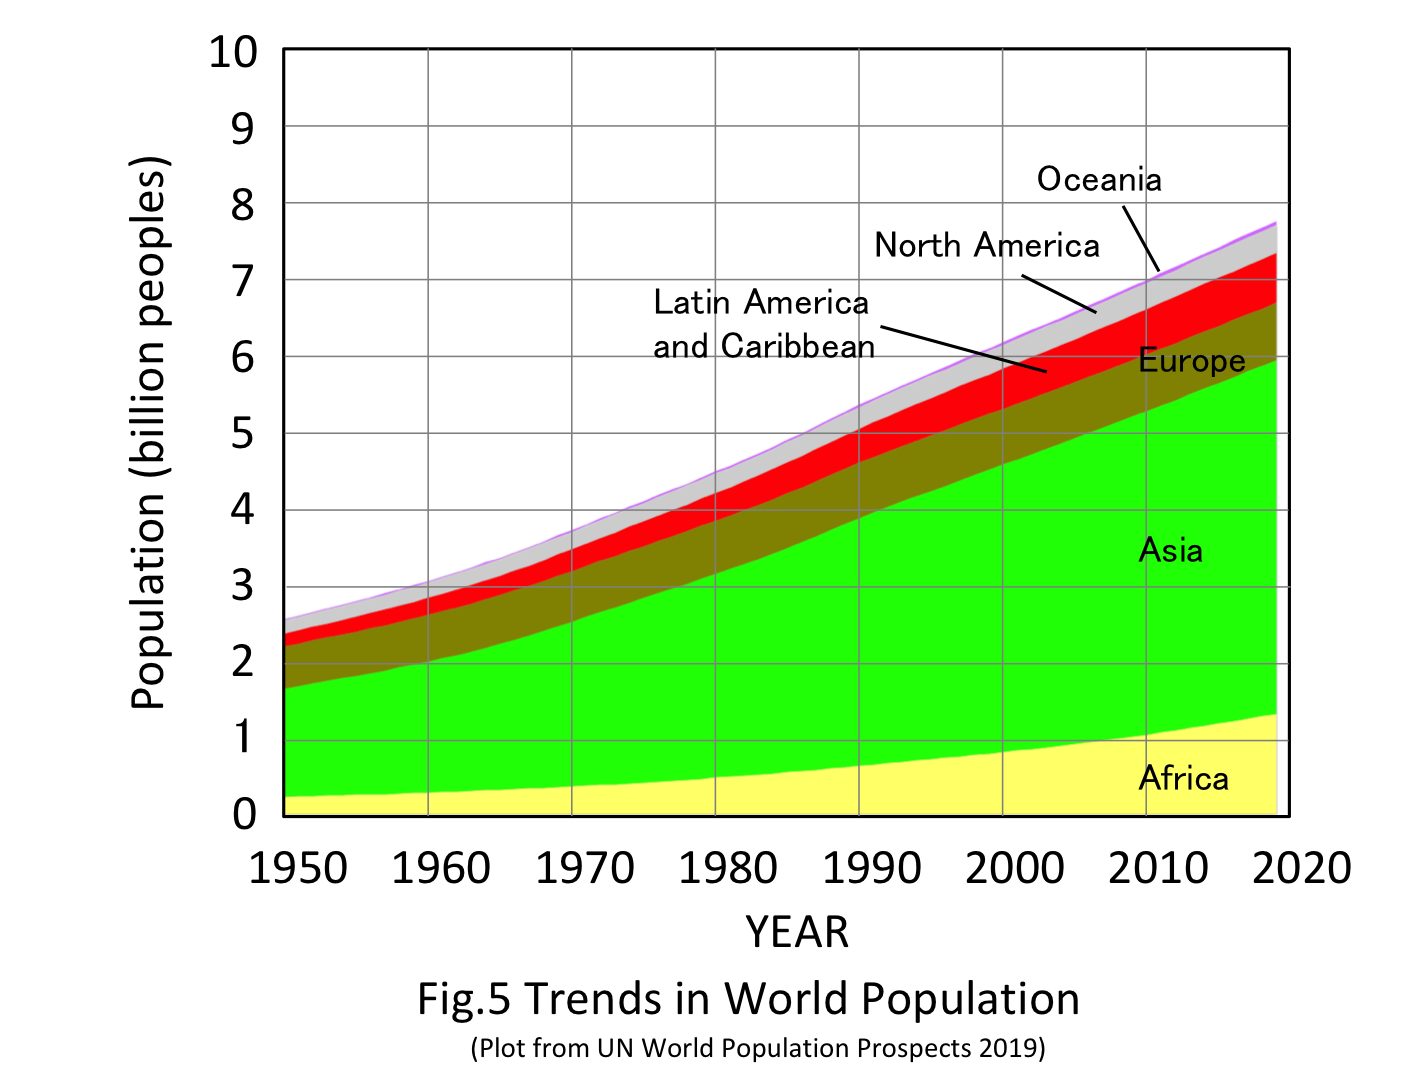
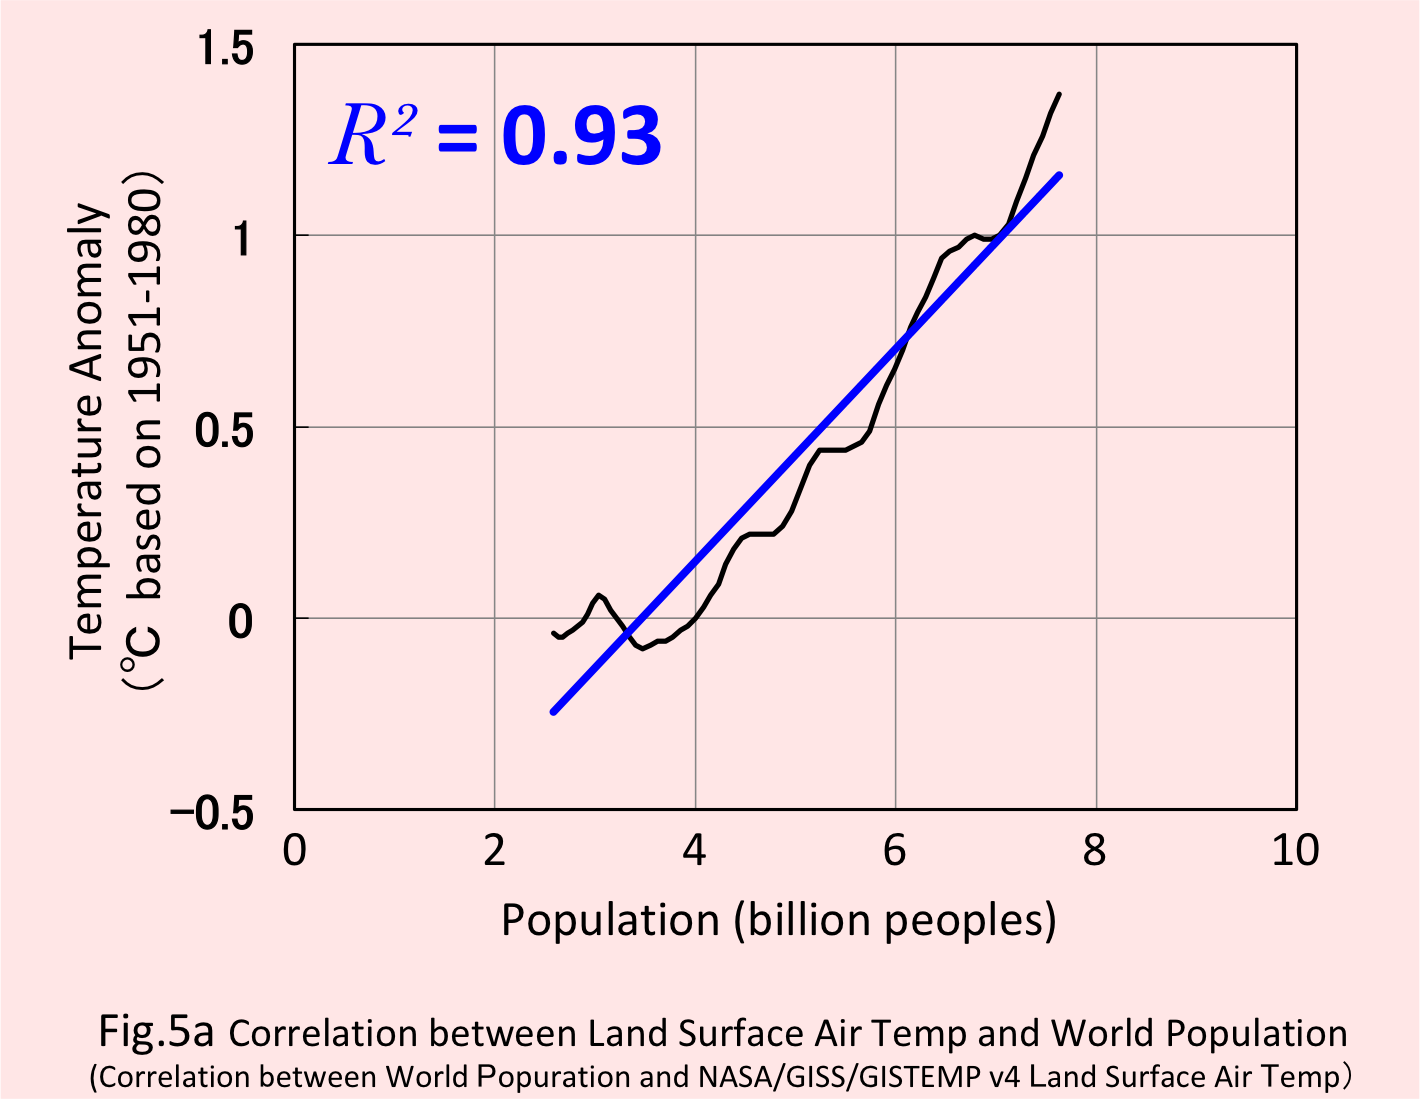
Next is the correlation between world population and global warming. It was =0.93. I think that population increase is more correlated than primary energy consumption, as it is accompanied by greenhouse gas emissions from humans and livestock in addition to energy consumption.
7. Correlation between global warming and air transportation
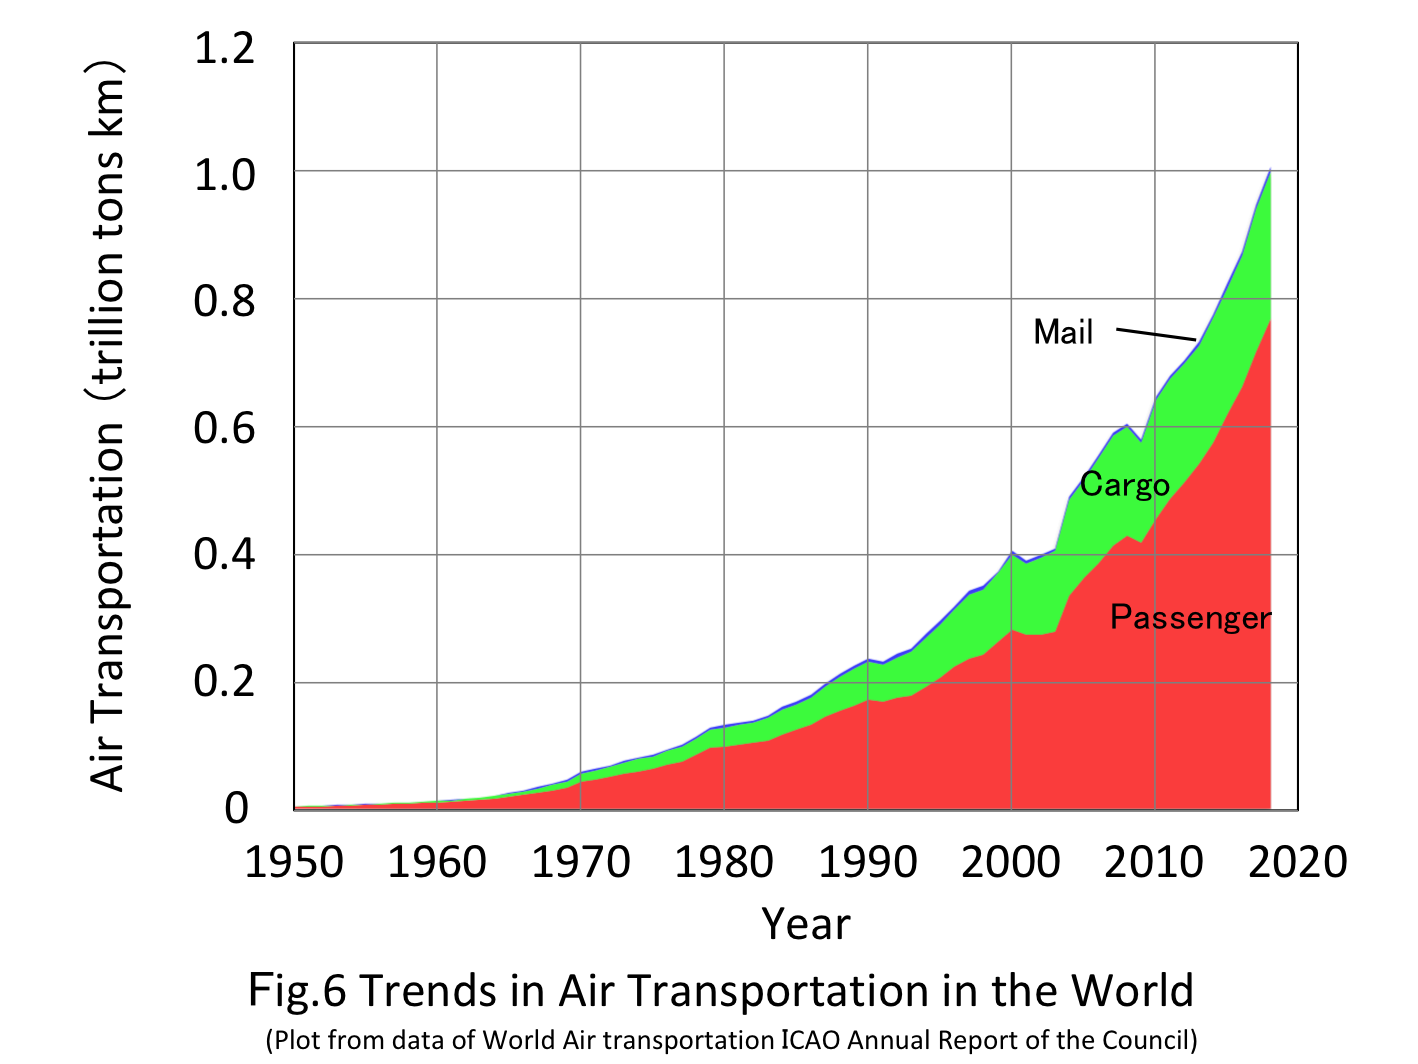
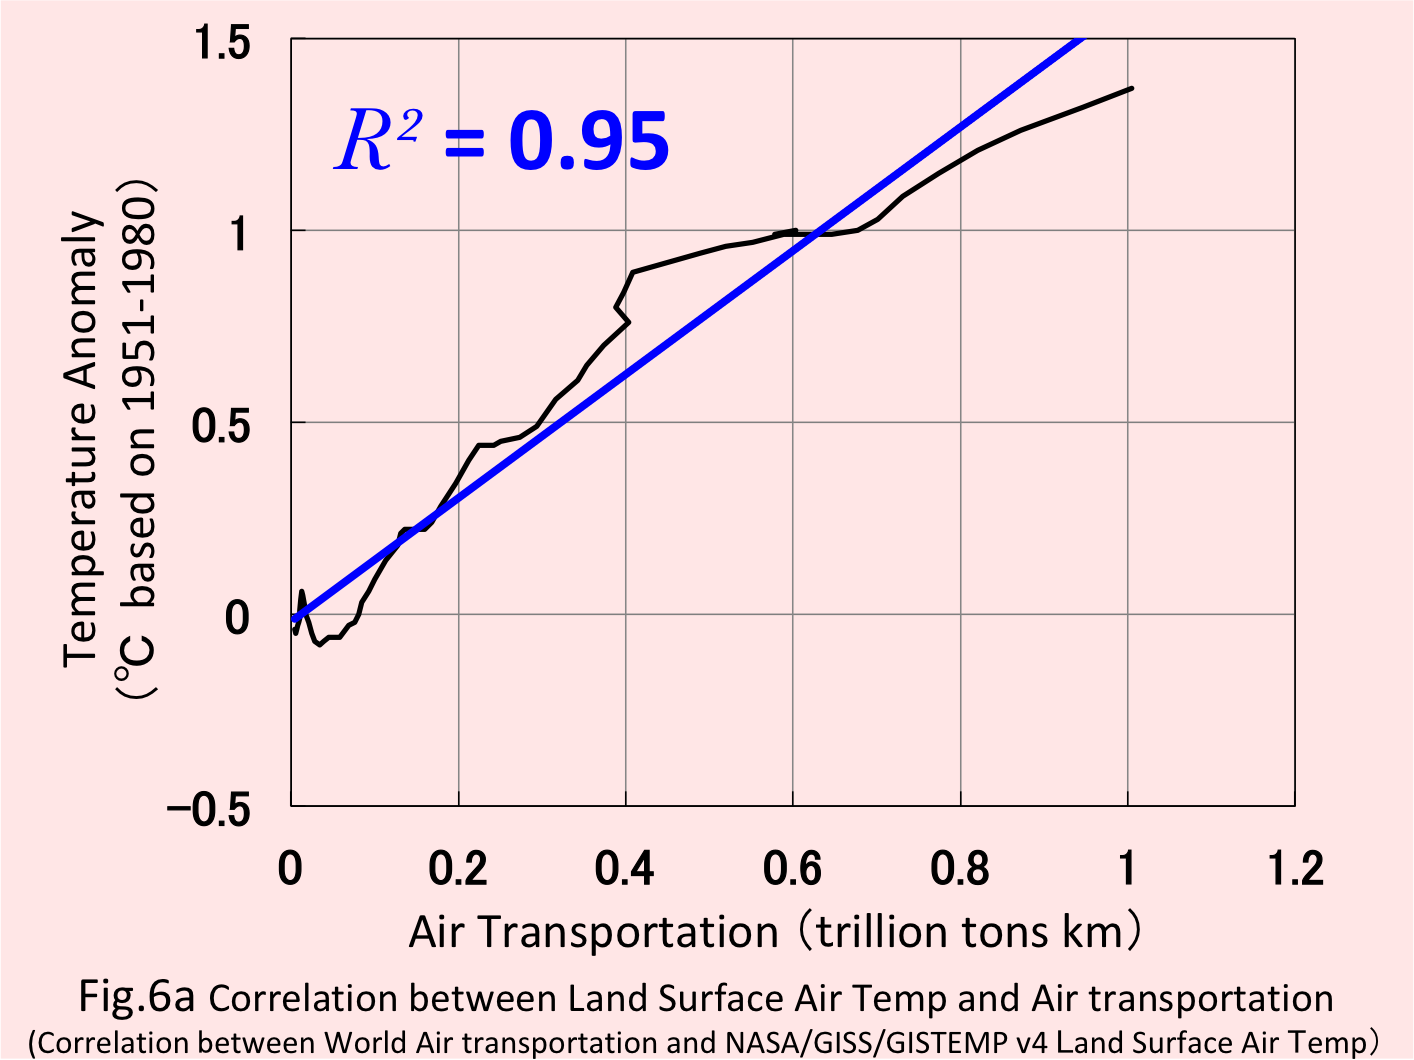
Next is the correlation between air traffic and global warming. The warming effects of carbon dioxide and water vapor overlap near the surface of the earth, but the warming effects of carbon dioxide dominate at an altitude of 10,000 m, where commercial aircraft fly. It became larger at =0.95.
However, the shape of the correlation graph is different from the indexes so far. Global warming is small compared to the increase in air traffic over the last 20 years. This is the result of 50 years of improved aircraft fuel eficiency.8. Correlation between global warming and world GDP
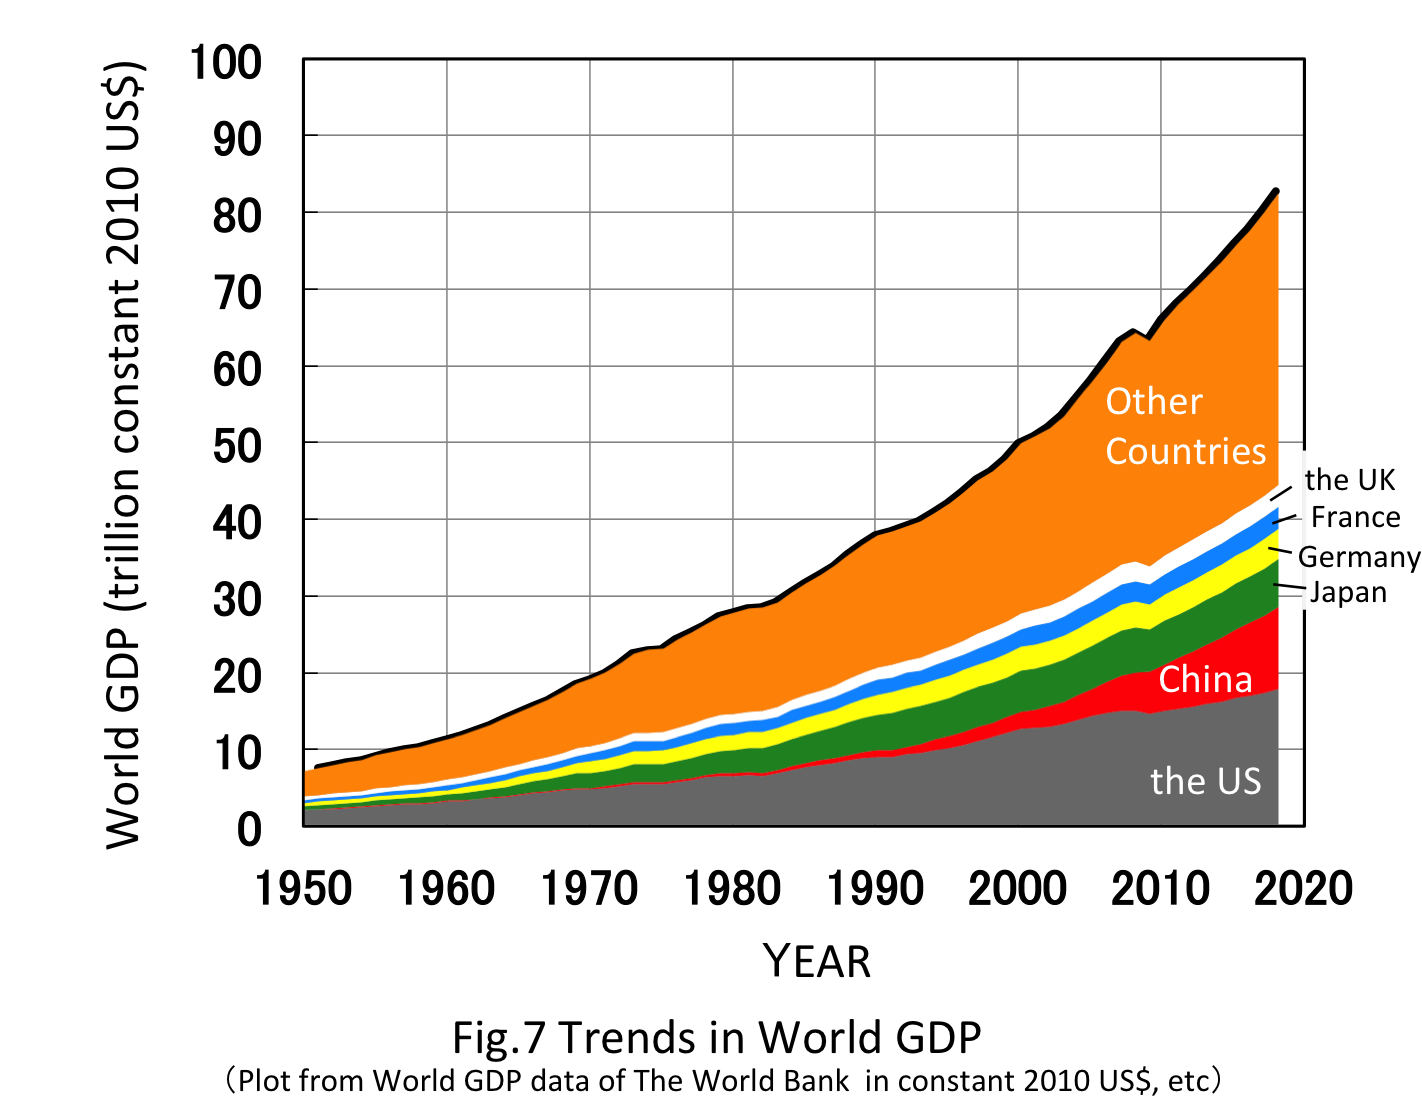
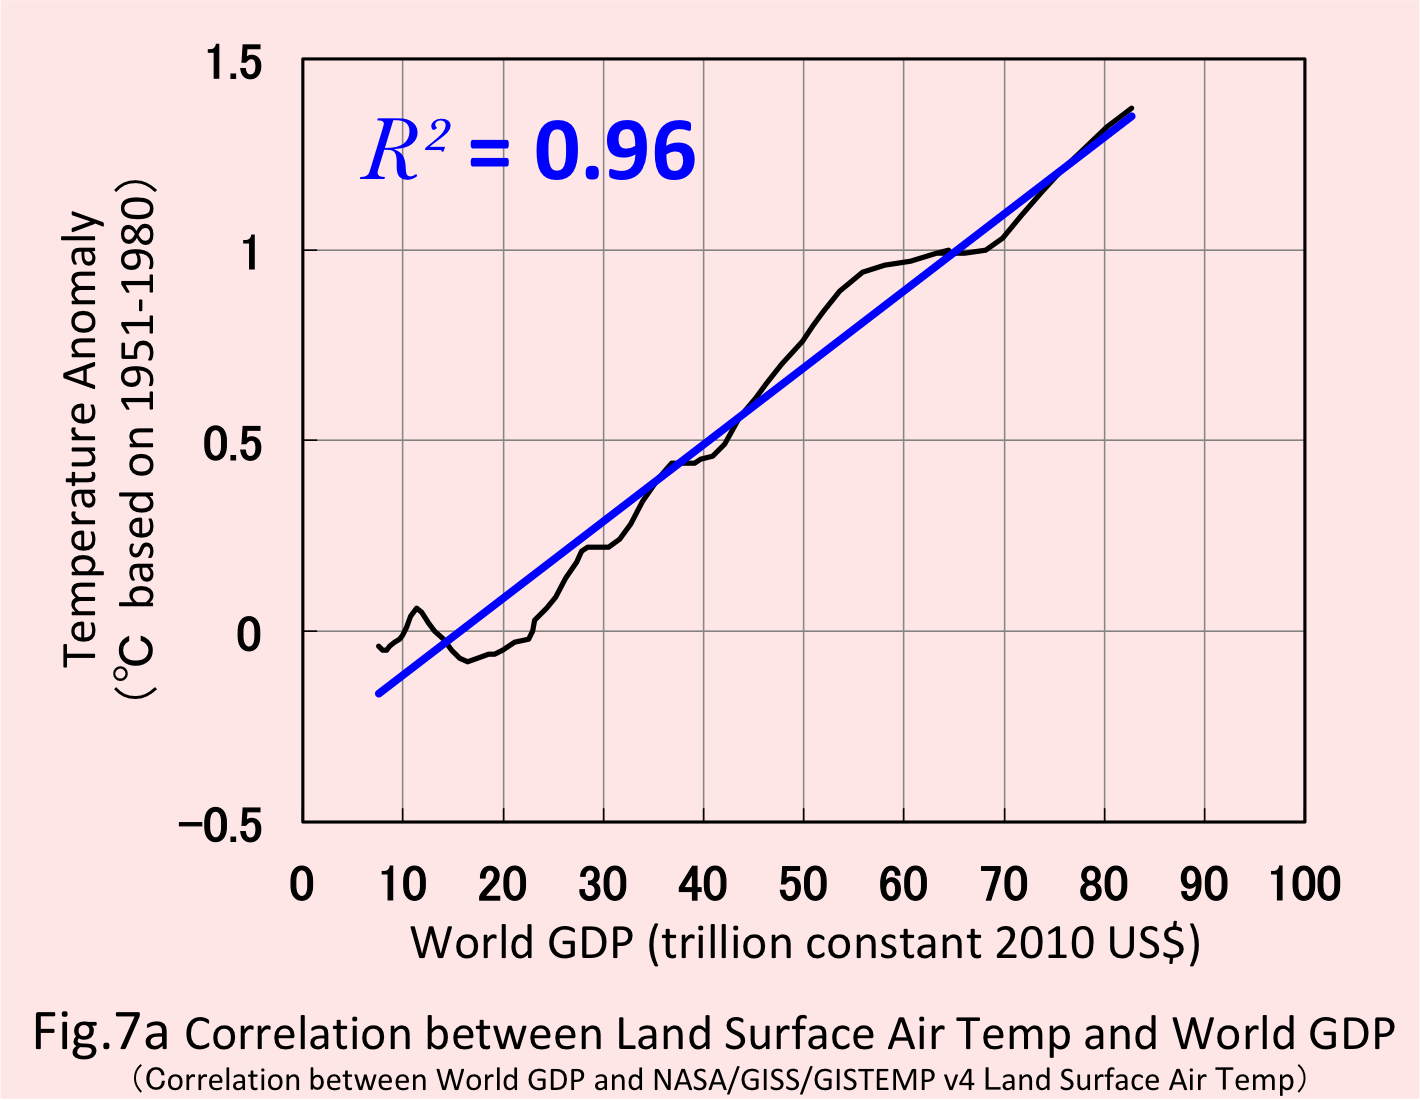
The last is the correlation between global GDP (constant 2010 US$ base) and global warming. GDP is an economic indicator for all human activities.=0.96, the second highest after the carbon dioxide concentration.
THE WORLD BANK World GDP9. Summary of correlation between global warming and human activities
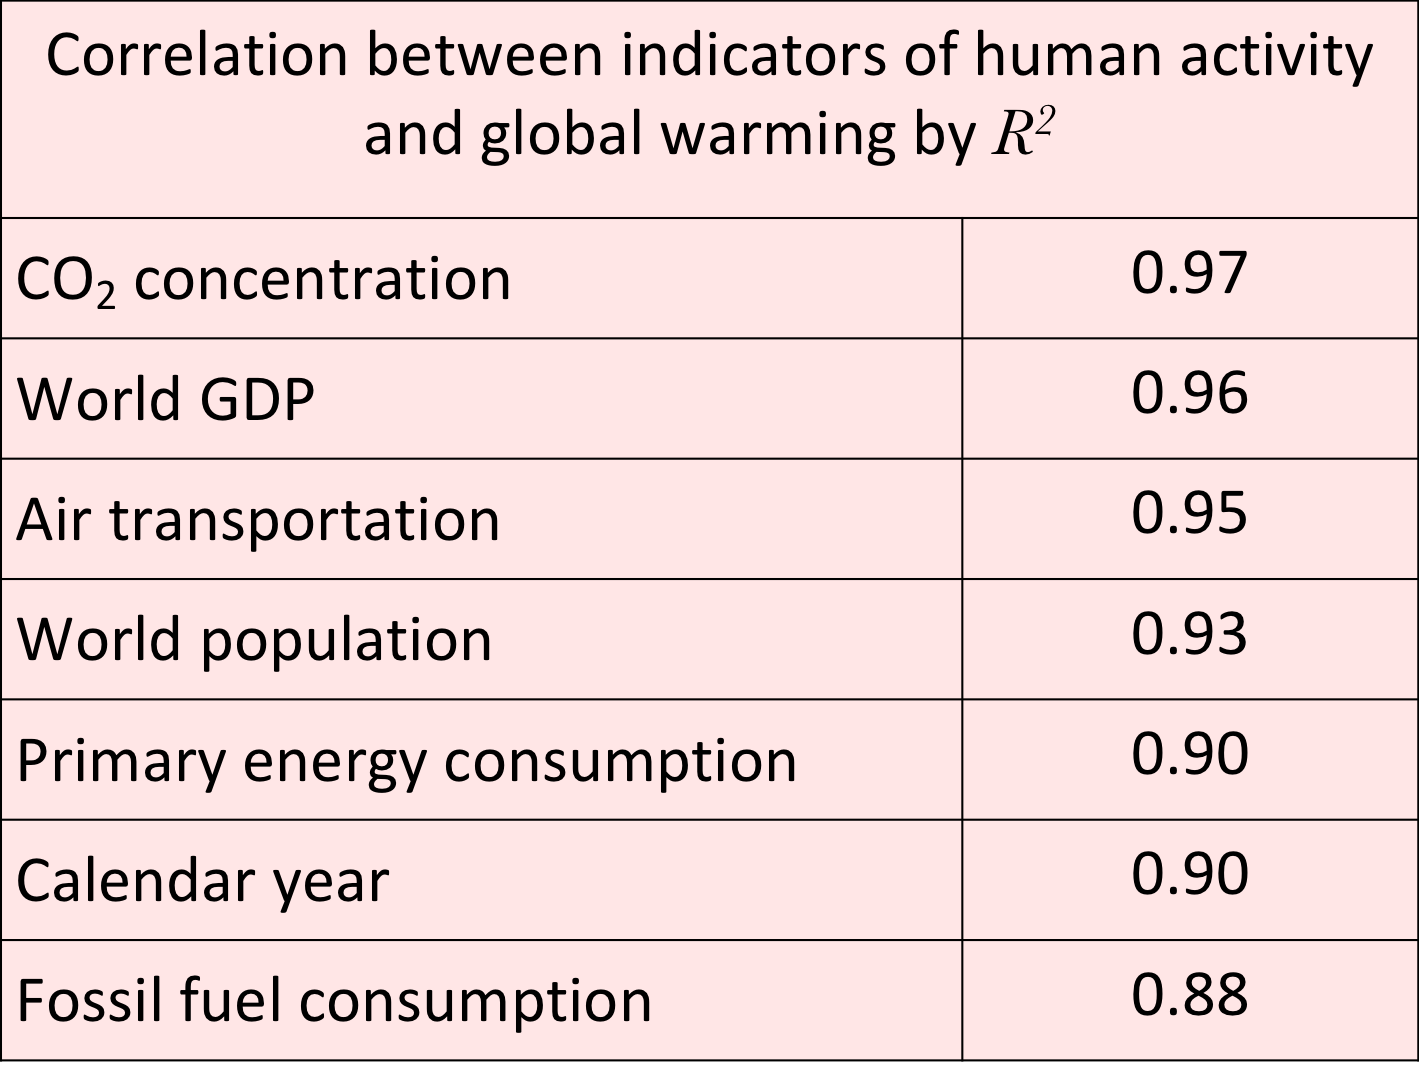
Compare the results so far. The carbon dioxide concentration of greenhouse gases show the largest correlation, and the second was the economic indicator GDP. I would like to find out why the fossil fuel correlation was smaller than the calendar year on the next page.