Global warming(2)
1. Warming in some places

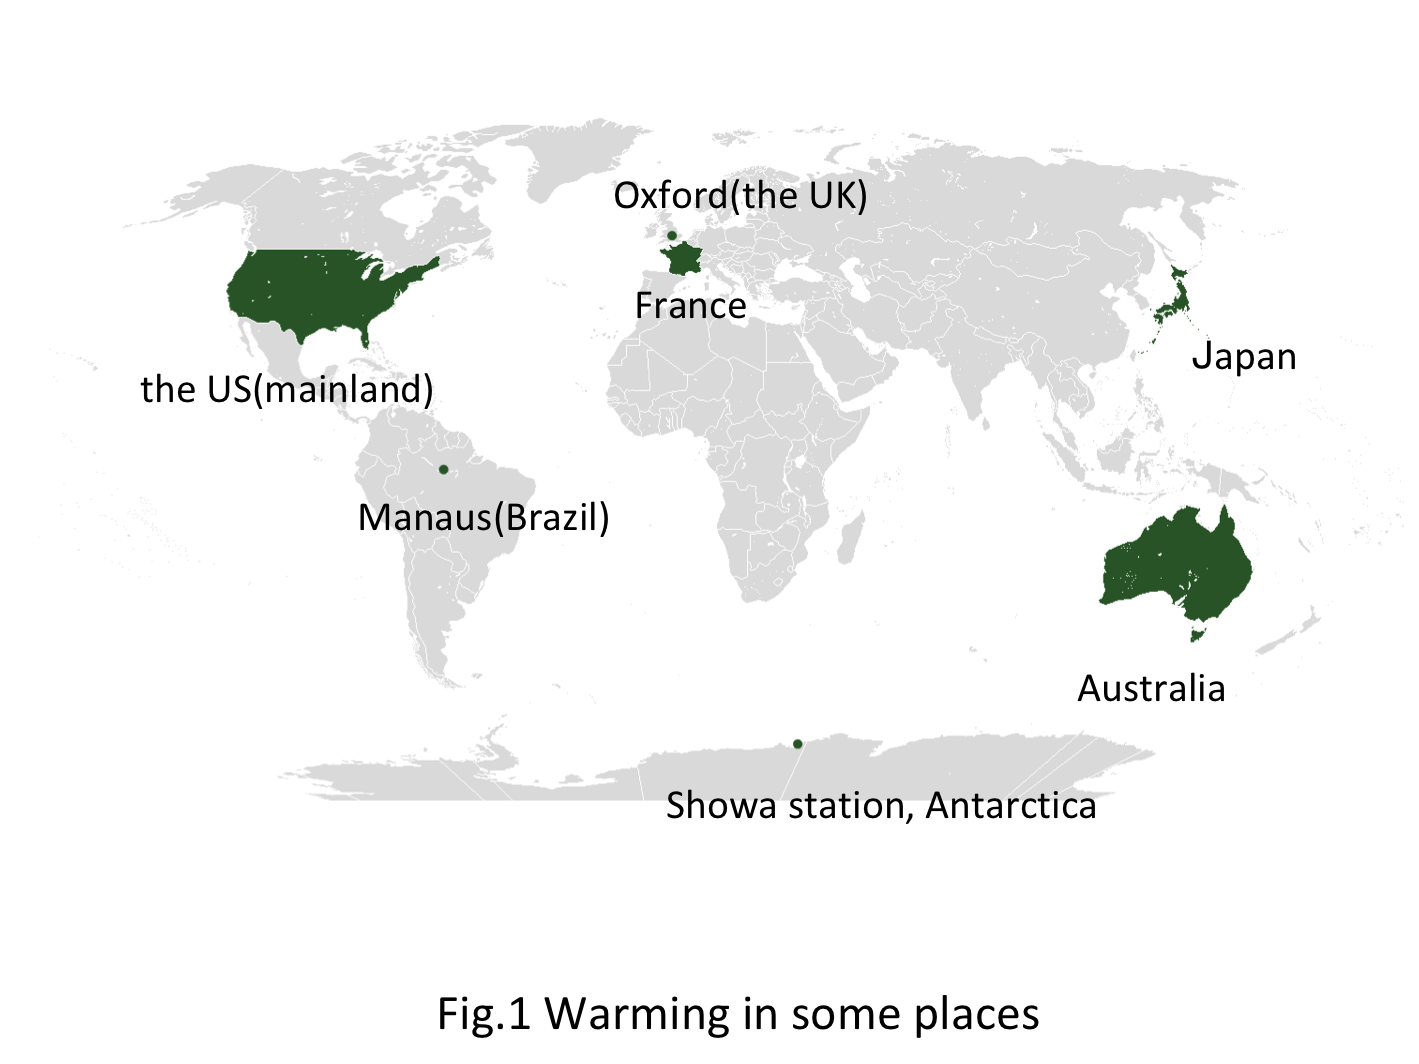
I would like to look at the global warming shown in Figure 1. Many meteological offices show the deviation from the average temperature for the reference period, but this page displays the temperature value as it is.
2. Global warming observation in Japan

The Japan Meteorological Agency observes global warming at 15 points. There are continuous data from 1898 for them, and locations where the impact of urbanization is small are selected.
Blank map is made by CraftMAP3. Warming at 15 points in Japan


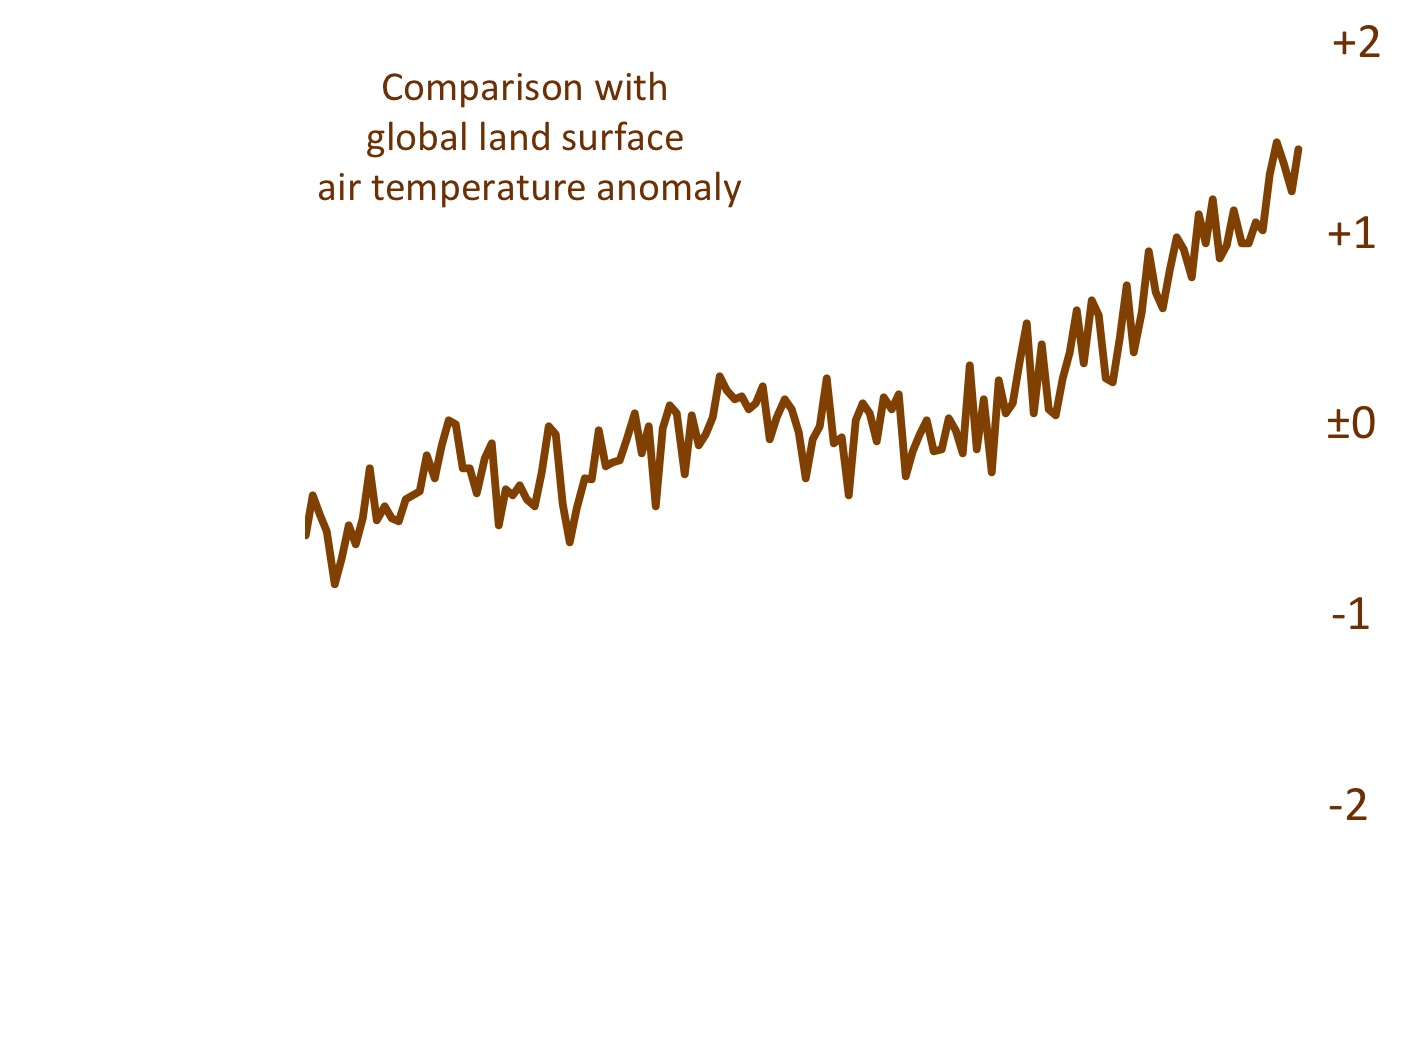
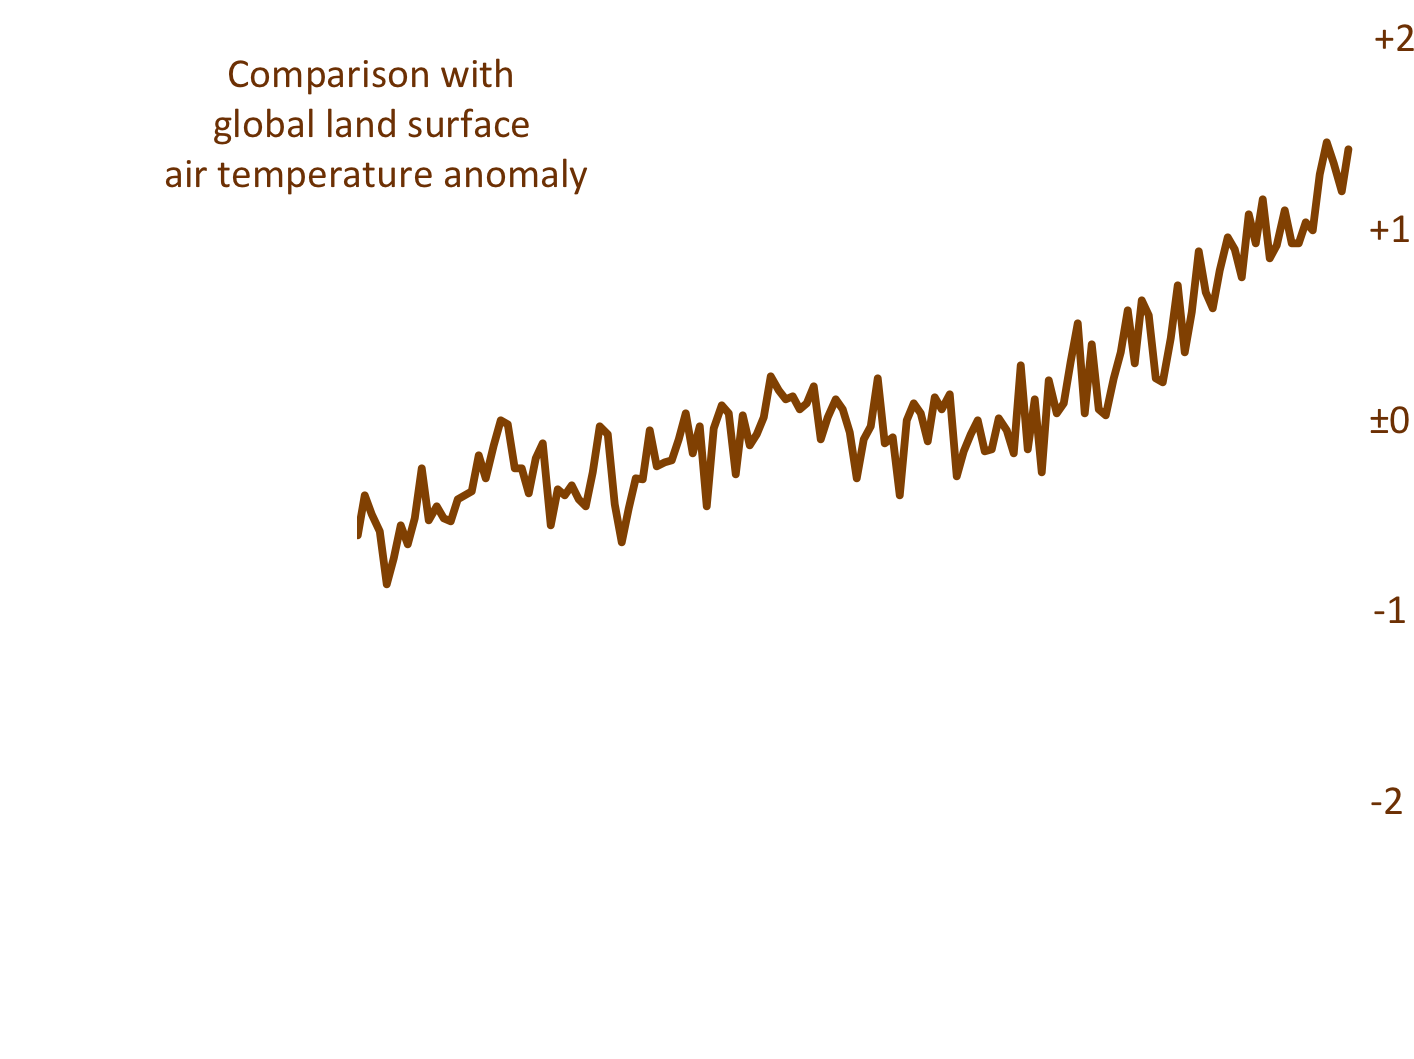
Figure 3 shows the annual average temperature changes at 15 points in Japan. Global warming is progressing at a rate of +1.24℃ per century. (By tapping the graph, you can compare it with the transition of the temperature deviation on the Land Surface Air Temperature based on the average temperature from 1951 to 1980.)
4. Warming at Showa Station, Antarctica


The Japan Meteorological Agency is also making meteorological observations at Showa Station in Antarctica. There is continuous data from 1967. It seems that the area around Showa Base has not warmed.
5. Warming in Australia


Most of Australia's land is desert and the average temperature exceeds 20°C. If you look at the changes in temperature, you can see that warming has accelerated since the 1980s.
6. Warming in the US (mainland)


Opinions may be divided regarding warming in the United States (mainland). From the 1950s to the 1970s, there was a tendency toward cold weather, and the temperature seems to undulate for 100 years. Similar to Australia, it has started to warm since the 1980s, but there has been a temperature fluctuation over the last 10 years that would offset it.
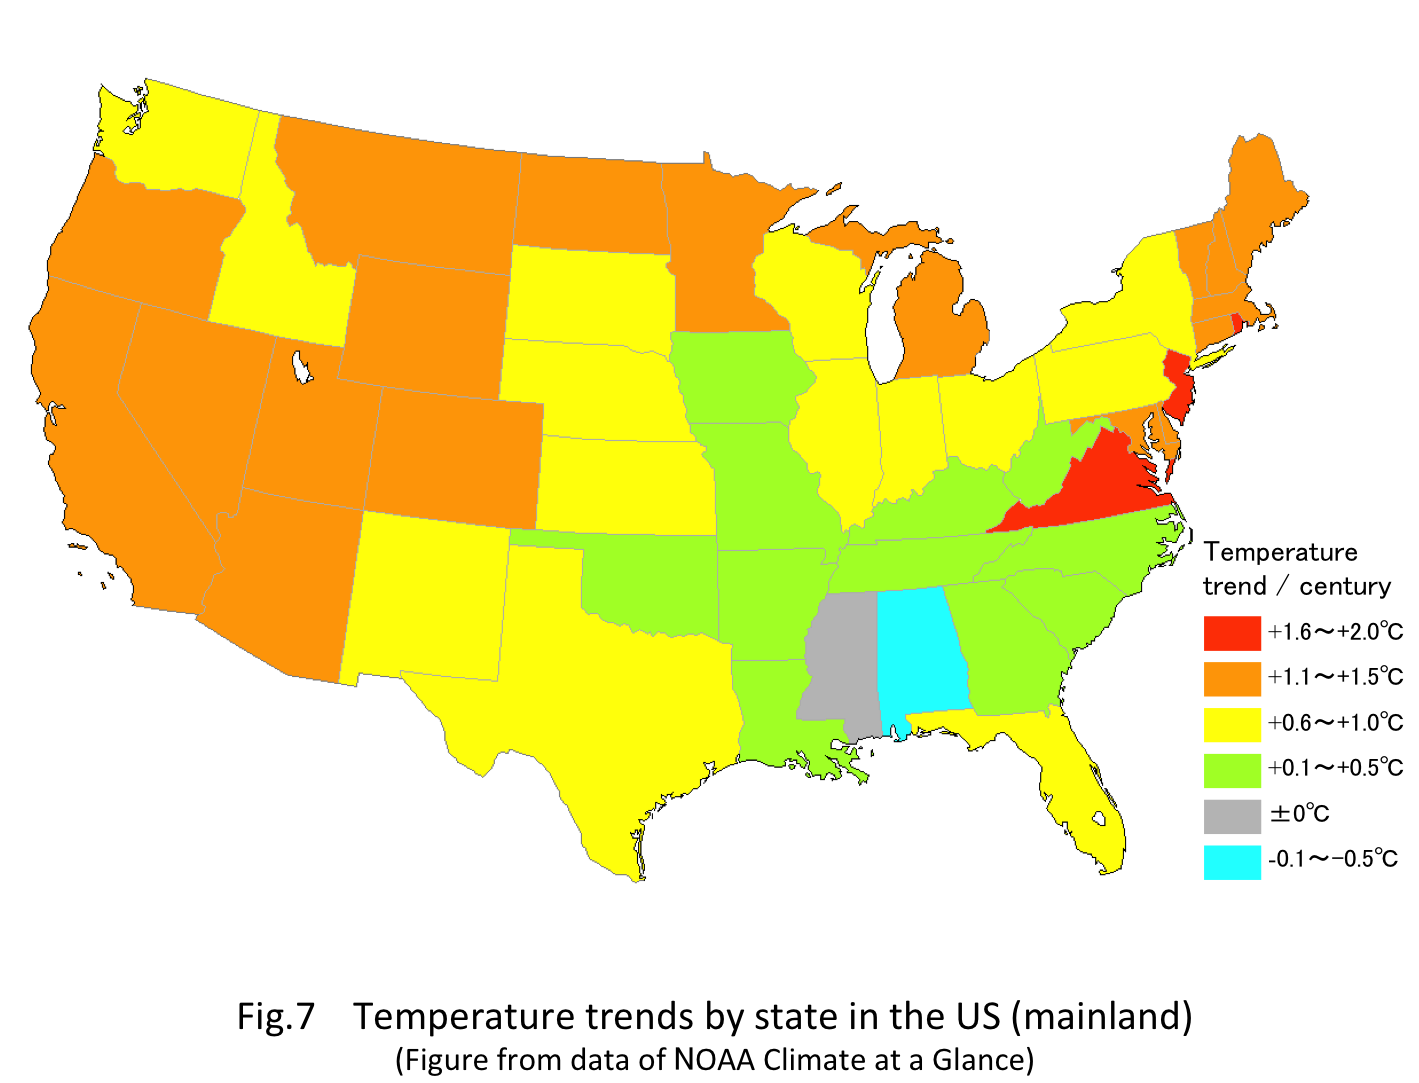
NOAA Climate at a Glance7. Warming in the US (mainland), trends by state


NOAA Climate at a Glance shows the warming trend of each state. Looking at the trend of temperature change per century, it is getting colder in some states. Alabama in the southeast. People in this area may find it hard to feel global warming. On the contrary, in the northeastern region where the population density is high, the temperature rises significantly compared to other regions.
8. Warming in France


Figure 8 shows the average temperature change at 30 points where the temperature change is observed in France. Baseline is around 12℃. In France, like other countries, it seems that warming has accelerated since the 1980s.
9. Warming in Manaus (Brazil)


Let's look at warming in the rainforest. Manaus is the capital of the Brazilian state of Amazonas, located in the center of the Amazon rainforest. Figure 9 shows the temperature change from 1979, you can see the same warming as in other countries.
10. Warming in Oxford (the UK)


The dates of beginning continuous weather records vary from place to place. As far as I examined, the weather record of Oxford (UK) could be traced back to the oldest. Warming of 166 years from 1853 to 2019 is 1.4℃ (+0.9℃ per century).